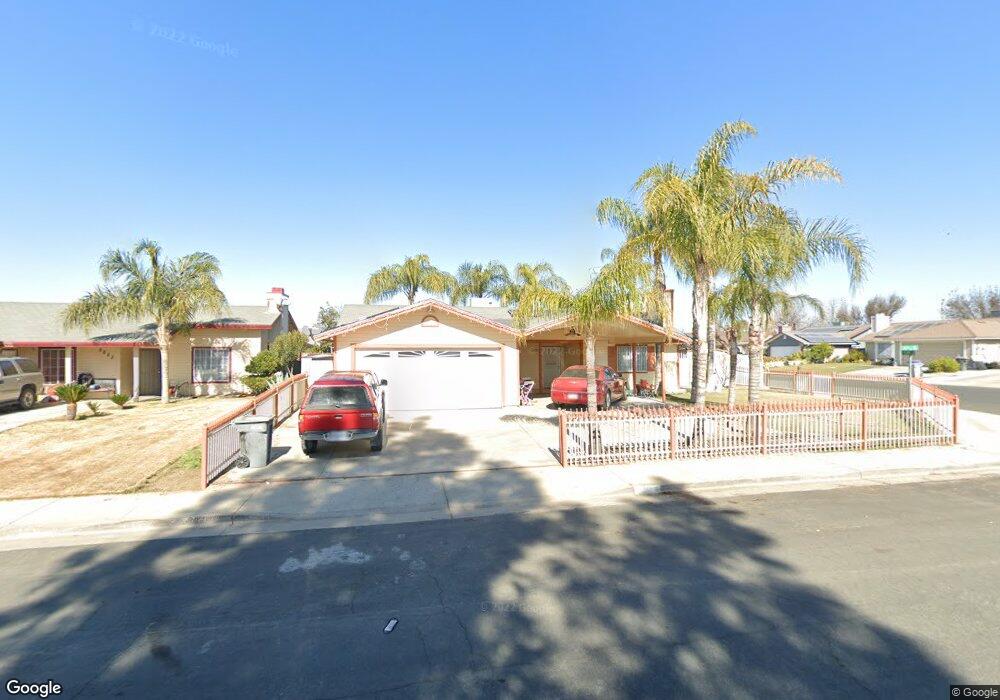
2229 18th Ave Delano, CA 93215
East Delano NeighborhoodEstimated Value: $326,060 - $446,000
4
Beds
2
Baths
1,436
Sq Ft
$257/Sq Ft
Est. Value
About This Home
This home is located at 2229 18th Ave, Delano, CA 93215 and is currently estimated at $369,515, approximately $257 per square foot. 2229 18th Ave is a home located in Kern County with nearby schools including Harvest Elementary School, La Vina Middle School, and Delano High School.
Ownership History
Date
Name
Owned For
Owner Type
Purchase Details
Closed on
Oct 24, 2007
Sold by
Martinez Olivia B
Bought by
Martinez David
Current Estimated Value
Home Financials for this Owner
Home Financials are based on the most recent Mortgage that was taken out on this home.
Original Mortgage
$125,000
Interest Rate
6.29%
Mortgage Type
New Conventional
Create a Home Valuation Report for This Property
The Home Valuation Report is an in-depth analysis detailing your home's value as well as a comparison with similar homes in the area
Home Values in the Area
Average Home Value in this Area
Purchase History
| Date | Buyer | Sale Price | Title Company |
|---|---|---|---|
| Martinez David | -- | Financial Title Company |
Source: Public Records
Mortgage History
| Date | Status | Borrower | Loan Amount |
|---|---|---|---|
| Closed | Martinez David | $125,000 |
Source: Public Records
Tax History
| Year | Tax Paid | Tax Assessment Tax Assessment Total Assessment is a certain percentage of the fair market value that is determined by local assessors to be the total taxable value of land and additions on the property. | Land | Improvement |
|---|---|---|---|---|
| 2025 | $1,666 | $132,587 | $35,348 | $97,239 |
| 2024 | $1,619 | $129,988 | $34,655 | $95,333 |
| 2023 | $1,619 | $127,440 | $33,976 | $93,464 |
| 2022 | $1,591 | $124,942 | $33,310 | $91,632 |
| 2021 | $1,522 | $122,493 | $32,657 | $89,836 |
| 2020 | $1,518 | $121,238 | $32,323 | $88,915 |
| 2019 | $1,492 | $121,238 | $32,323 | $88,915 |
| 2018 | $1,474 | $116,532 | $31,069 | $85,463 |
| 2017 | $1,483 | $114,248 | $30,460 | $83,788 |
| 2016 | $1,460 | $112,009 | $29,863 | $82,146 |
| 2015 | $1,508 | $110,328 | $29,415 | $80,913 |
| 2014 | $1,410 | $108,168 | $28,839 | $79,329 |
Source: Public Records
Map
Nearby Homes
- 2203 19th Ave
- 1741 Vassar St
- 1612 Xenia Ct
- 1911 Sierra Vista Dr
- 1825 Robinson St
- 2216 Palomar Ct
- 1736 17th Ave
- 1914 Hummingbird Ave
- 1732 17th Ave
- 1725 17th Place
- 0 Cecil Ave
- 2617 Sillano Dr
- 2209 Ruffino Ct
- 2226 Via Tuscania Ave
- 0 Bassett Ave
- 2040 Sestino St
- 1201 Quincy St
- 1257 Oxford St
- 2113 Princeton St
- 1733 8th Ave
Your Personal Tour Guide
Ask me questions while you tour the home.