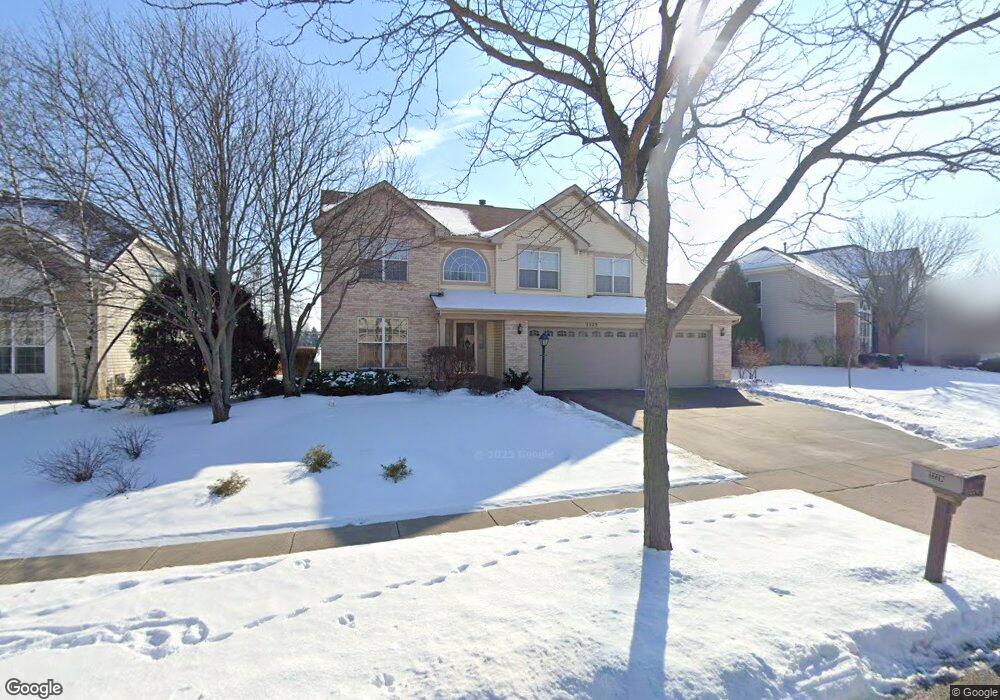
2229 Moser Ln Algonquin, IL 60102
Algonquin AreaEstimated Value: $548,669
About This Home
This home is located at 2229 Moser Ln, Algonquin, IL 60102 and is currently priced at $548,669, approximately $211 per square foot. 2229 Moser Ln is a home located in Kane County.
Ownership History
We collect this data history from publicly available records. To have your information removed, we recommend requesting removal directly through your county’s website.
Purchase Details
Purchase History
We collect this data history from publicly available records. To have your information removed, we recommend requesting removal directly through your county’s website.
| Date | Buyer | Sale Price | Title Company |
|---|---|---|---|
| $233,000 | Stewart Title Company |
Mortgage History
We collect this data history from publicly available records. To have your information removed, we recommend requesting removal directly through your county’s website.
| Date | Status | Borrower | Loan Amount |
|---|---|---|---|
| Open | $186,000 | ||
| Closed | $248,000 | ||
| Closed | $50,000 | ||
| Closed | $246,400 | ||
| Closed | $33,200 |
Tax History
We collect this data history from publicly available records. To have your information removed, we recommend requesting removal directly through your county’s website.
| Year | Tax Paid | Tax Assessment Tax Assessment Total Assessment is a certain percentage of the fair market value that is determined by local assessors to be the total taxable value of land and additions on the property. | Land | Improvement |
|---|---|---|---|---|
| 2024 | $10,161 | $142,987 | $28,016 | $114,971 |
| 2023 | $8,086 | $128,655 | $25,208 | $103,447 |
| 2022 | $8,721 | $122,174 | $25,208 | $96,966 |
| 2021 | $8,998 | $115,356 | $23,801 | $91,555 |
| 2020 | $8,816 | $112,763 | $23,266 | $89,497 |
| 2019 | $8,528 | $107,047 | $22,087 | $84,960 |
| 2018 | $9,121 | $104,928 | $21,650 | $83,278 |
| 2017 | $8,762 | $98,156 | $20,253 | $77,903 |
| 2016 | $8,543 | $90,613 | $19,610 | $71,003 |
| 2015 | -- | $81,691 | $17,040 | $64,651 |
| 2014 | -- | $75,029 | $16,569 | $58,460 |
| 2013 | -- | $77,325 | $17,076 | $60,249 |
Map
- 1820 Broadsmore Dr
- 1211 Waterford St
- 1200 Waterford St
- 111 Newburgh Ln
- 301 Cold Spring St
- 2020 Cosman Way
- 131 Newburgh Ln
- 311 Cold Spring St
- 141 Newburgh Ln
- 1961 Broadsmore Dr
- 1000 Glenmont St
- 350 Cold Spring St
- 1041 Glenmont St
- 1600 Creeks Crossing Dr
- 370 Cold Spring St
- 6 Yorkshire Ct
- 1030 Glenmont St
- 2234 Stonegate Rd
- 1090 Glenmont St
- 1111 Glenmont St
Ask me questions while you tour the home.