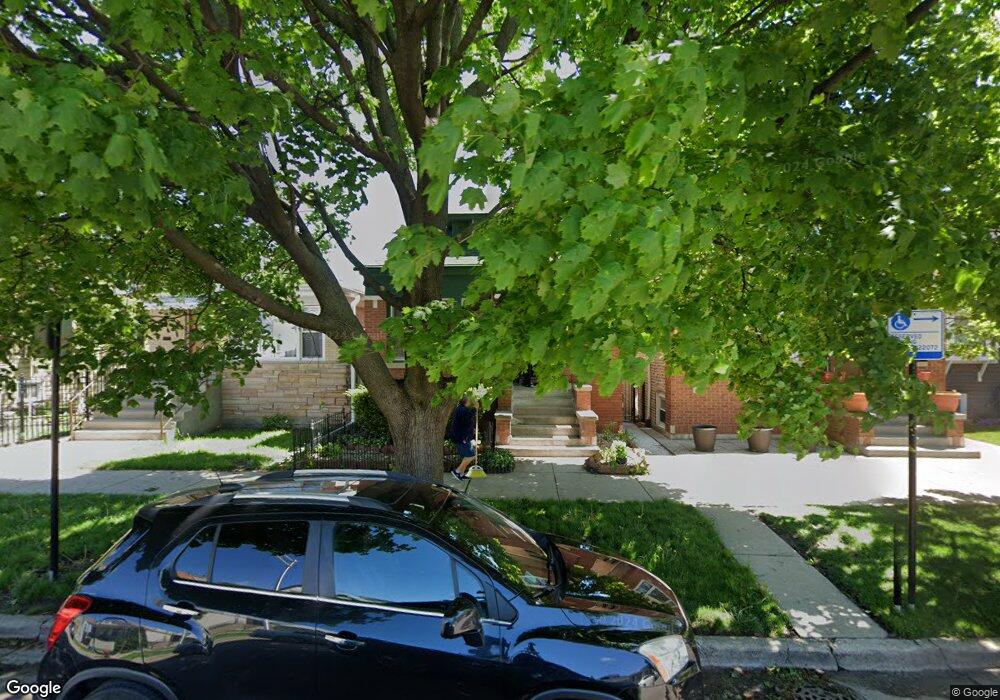
2229 N Mason Ave Chicago, IL 60639
Belmont Central NeighborhoodEstimated Value: $231,000 - $351,000
2
Beds
2
Baths
849
Sq Ft
$346/Sq Ft
Est. Value
About This Home
This home is located at 2229 N Mason Ave, Chicago, IL 60639 and is currently estimated at $293,512, approximately $345 per square foot. 2229 N Mason Ave is a home located in Cook County with nearby schools including Burbank Elementary School, Steinmetz College Prep, and CICS West Belden.
Ownership History
Date
Name
Owned For
Owner Type
Purchase Details
Closed on
Dec 23, 1998
Sold by
Butler Marlene
Bought by
Figueroa Hector M and Figueroa Sara
Current Estimated Value
Home Financials for this Owner
Home Financials are based on the most recent Mortgage that was taken out on this home.
Original Mortgage
$88,957
Interest Rate
7.04%
Mortgage Type
FHA
Purchase Details
Closed on
Sep 15, 1994
Sold by
Butler Marlene and Adams Lawrence F
Bought by
Butler Marlene
Create a Home Valuation Report for This Property
The Home Valuation Report is an in-depth analysis detailing your home's value as well as a comparison with similar homes in the area
Home Values in the Area
Average Home Value in this Area
Purchase History
| Date | Buyer | Sale Price | Title Company |
|---|---|---|---|
| Figueroa Hector M | $92,000 | Professional National Title | |
| Butler Marlene | -- | -- |
Source: Public Records
Mortgage History
| Date | Status | Borrower | Loan Amount |
|---|---|---|---|
| Previous Owner | Figueroa Hector M | $88,957 |
Source: Public Records
Tax History Compared to Growth
Tax History
| Year | Tax Paid | Tax Assessment Tax Assessment Total Assessment is a certain percentage of the fair market value that is determined by local assessors to be the total taxable value of land and additions on the property. | Land | Improvement |
|---|---|---|---|---|
| 2024 | $2,890 | $16,000 | $5,781 | $10,219 |
| 2023 | $2,796 | $17,001 | $4,688 | $12,313 |
| 2022 | $2,796 | $17,001 | $4,688 | $12,313 |
| 2021 | $2,752 | $17,005 | $4,693 | $12,312 |
| 2020 | $2,593 | $14,735 | $3,906 | $10,829 |
| 2019 | $2,639 | $16,557 | $3,906 | $12,651 |
| 2018 | $2,594 | $16,557 | $3,906 | $12,651 |
| 2017 | $2,582 | $15,363 | $3,437 | $11,926 |
| 2016 | $2,578 | $15,363 | $3,437 | $11,926 |
| 2015 | $2,336 | $15,363 | $3,437 | $11,926 |
| 2014 | $2,404 | $15,516 | $3,125 | $12,391 |
| 2013 | $2,345 | $15,516 | $3,125 | $12,391 |
Source: Public Records
Map
Nearby Homes
- 2241 N Monitor Ave
- 2123 N Austin Ave
- 2314 N Mango Ave
- 2255 N Mango Ave
- 2119 N Mcvicker Ave
- 2341 N Major Ave
- 2448 N Major Ave
- 2536 N Austin Ave
- 2335 N Merrimac Ave
- 2430 N Central Ave
- 2419 N Central Ave
- 2531 N Major Ave
- 2630 N Austin Ave
- 2601 N Moody Ave
- 2612 N Moody Ave
- 1805 N Mason Ave
- 2537 N Luna Ave
- 1742 N Mayfield Ave
- 2714 N Mango Ave
- 2728 N Mango Ave
- 2227 N Mason Ave
- 2231 N Mason Ave
- 2223 N Mason Ave
- 2237 N Mason Ave
- 2221 N Mason Ave
- 2239 N Mason Ave
- 2219 N Mason Ave
- 2241 N Mason Ave
- 2215 N Mason Ave
- 2215 N Mason Ave
- 2236 N Marmora Ave
- 2234 N Marmora Ave
- 2240 N Marmora Ave Unit 2
- 2240 N Marmora Ave
- 2242 N Marmora Ave
- 2242 N Marmora Ave
- 2232 N Marmora Ave
- 2243 N Mason Ave
- 2230 N Marmora Ave
- 2244 N Marmora Ave