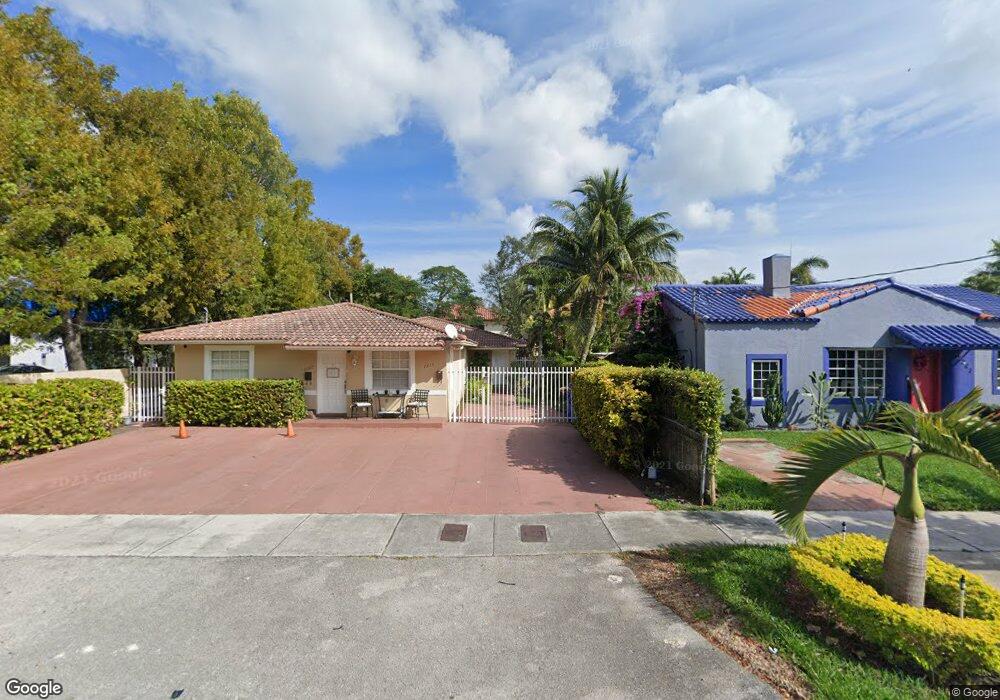
2229 SW 16th Ct Miami, FL 33145
Coral Way NeighborhoodEstimated Value: $986,000 - $1,306,000
6
Beds
4
Baths
2,924
Sq Ft
$403/Sq Ft
Est. Value
About This Home
This home is located at 2229 SW 16th Ct, Miami, FL 33145 and is currently estimated at $1,178,595, approximately $403 per square foot. 2229 SW 16th Ct is a home located in Miami-Dade County with nearby schools including Coral Way K-8 Center, Shenandoah Middle School, and Miami Senior High School.
Ownership History
Date
Name
Owned For
Owner Type
Purchase Details
Closed on
Jul 20, 2016
Sold by
Mosquera Maria Isabel and Mosquera Julia E
Bought by
Bros Power Investment Llc
Current Estimated Value
Purchase Details
Closed on
Jan 14, 2016
Sold by
U S Bank National Association
Bought by
Mosquera Maria Isabel and Mosquera Julia E
Purchase Details
Closed on
Oct 1, 2015
Sold by
Benitez Roman O
Bought by
U S Bank National Association
Purchase Details
Closed on
Dec 22, 1995
Sold by
Gomez Michael C and Gomez Elizabeth
Bought by
Benitez Roman O and Benitez Blanca A
Home Financials for this Owner
Home Financials are based on the most recent Mortgage that was taken out on this home.
Original Mortgage
$108,500
Interest Rate
7.33%
Mortgage Type
New Conventional
Purchase Details
Closed on
Jan 27, 1995
Sold by
Roman Conrado San and Roman Maria San
Bought by
Gomez Michael C
Create a Home Valuation Report for This Property
The Home Valuation Report is an in-depth analysis detailing your home's value as well as a comparison with similar homes in the area
Home Values in the Area
Average Home Value in this Area
Purchase History
| Date | Buyer | Sale Price | Title Company |
|---|---|---|---|
| Bros Power Investment Llc | -- | Attorney | |
| Mosquera Maria Isabel | $450,000 | Attorney | |
| U S Bank National Association | $360,300 | None Available | |
| Benitez Roman O | $155,000 | -- | |
| Gomez Michael C | $74,000 | -- |
Source: Public Records
Mortgage History
| Date | Status | Borrower | Loan Amount |
|---|---|---|---|
| Previous Owner | Benitez Roman O | $108,500 |
Source: Public Records
Tax History Compared to Growth
Tax History
| Year | Tax Paid | Tax Assessment Tax Assessment Total Assessment is a certain percentage of the fair market value that is determined by local assessors to be the total taxable value of land and additions on the property. | Land | Improvement |
|---|---|---|---|---|
| 2025 | $15,700 | $743,626 | -- | -- |
| 2024 | $15,188 | $676,024 | -- | -- |
| 2023 | $15,188 | $612,133 | $0 | $0 |
| 2022 | $12,632 | $556,485 | $0 | $0 |
| 2021 | $11,509 | $505,896 | $341,550 | $164,346 |
| 2020 | $11,177 | $489,112 | $322,575 | $166,537 |
| 2019 | $11,248 | $491,304 | $322,575 | $168,729 |
| 2018 | $11,872 | $530,521 | $286,350 | $244,171 |
| 2017 | $12,065 | $533,652 | $0 | $0 |
| 2016 | $12,476 | $536,782 | $0 | $0 |
| 2015 | $10,634 | $440,908 | $0 | $0 |
| 2014 | $9,850 | $400,826 | $0 | $0 |
Source: Public Records
Map
Nearby Homes
- 2280 SW 16th Ct
- 2295 SW 16th Ct Unit B
- 1650 Coral Way Unit 807
- 1650 Coral Way Unit 507
- 1650 Coral Way Unit 403
- 1650 Coral Way Unit 601
- 2298 SW 16th Ave
- 2340 SW 17th Ave
- 2160 SW 16th Ave Unit 421
- 1387 SW 22nd Terrace
- 1701 SW 21st St
- 1721 SW 24th Terrace
- 248th st Route 1
- 3635 SW 3rd Ave
- 1765 SW 21st St
- 2496 SW 17th Ave Unit 5301
- 3645 SW 1st Ave
- 1691 Nethia Dr
- 2498 SW 17th Ave Unit 4105
- 2498 SW 17th Ave Unit 4311
- 2227 SW 16th Ct
- 2243 SW 16th Ct
- 2245 SW 16th Ct
- 2224 SW 16th Ave Unit 2224
- 2231 SW 16th Ave
- 2236 SW 16th Ave Unit 2236
- 2238 SW 16th Ave Unit 2238
- 2255 SW 16th Ct
- 2242 SW 16th Ave
- 2230 SW 16th Ct
- 2230 SW 16th Ct Unit 5
- 2230 SW 16th Ct Unit 1
- 2230 SW 16th Ct Unit 3
- 2230 SW 16th Ct Unit 4
- 2230 SW 16th Ct Unit 1-6
- 2230 SW 16th Ct Unit 2
- 2240 SW 16th Ave Unit 2240
- 2240 SW 16th Ave Unit 2040
- 2240 SW 16th Ct
- 2240 SW 16th Ct Unit 1