Estimated Value: $466,000 - $515,216
3
Beds
2
Baths
2,187
Sq Ft
$227/Sq Ft
Est. Value
About This Home
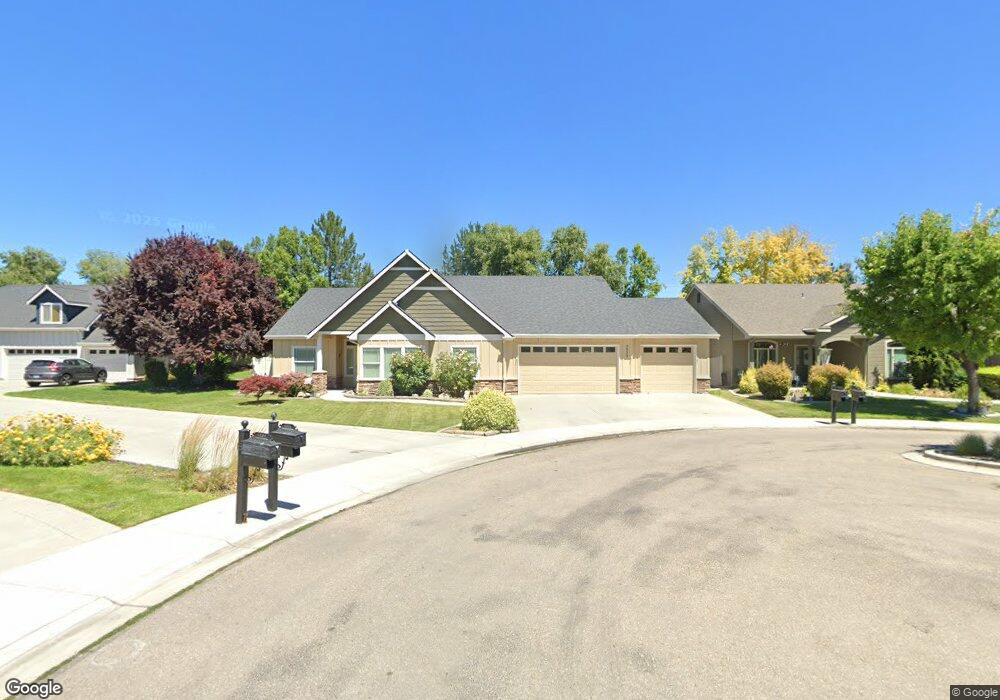
This home is located at 2229 W Herron Loop, Nampa, ID 83686 and is currently estimated at $496,054, approximately $226 per square foot. 2229 W Herron Loop is a home located in Canyon County with nearby schools including Owyhee Elementary School, South Middle School, and Skyview High School.
Ownership History
Date
Name
Owned For
Owner Type
Purchase Details
Closed on
Jun 4, 2010
Sold by
Whyte James A and Whyte Judith A
Bought by
Whyte James A and Whyte Judith A
Current Estimated Value
Purchase Details
Closed on
May 21, 2009
Sold by
Clark Barry D and Clark Jammie D
Bought by
Whyte James A and Whyte Judith A
Home Financials for this Owner
Home Financials are based on the most recent Mortgage that was taken out on this home.
Original Mortgage
$105,000
Outstanding Balance
$66,163
Interest Rate
4.8%
Mortgage Type
Purchase Money Mortgage
Estimated Equity
$429,891
Purchase Details
Closed on
Feb 2, 2007
Sold by
North Star Homes Llc
Bought by
Clark Barry D and Clark Jammie D
Home Financials for this Owner
Home Financials are based on the most recent Mortgage that was taken out on this home.
Original Mortgage
$90,000
Interest Rate
6.12%
Mortgage Type
Purchase Money Mortgage
Create a Home Valuation Report for This Property
The Home Valuation Report is an in-depth analysis detailing your home's value as well as a comparison with similar homes in the area
Home Values in the Area
Average Home Value in this Area
Purchase History
| Date | Buyer | Sale Price | Title Company |
|---|---|---|---|
| Whyte James A | -- | None Available | |
| Whyte James A | -- | Pioneer Title Company | |
| Clark Barry D | -- | Title One |
Source: Public Records
Mortgage History
| Date | Status | Borrower | Loan Amount |
|---|---|---|---|
| Open | Whyte James A | $105,000 | |
| Previous Owner | Clark Barry D | $90,000 |
Source: Public Records
Tax History
| Year | Tax Paid | Tax Assessment Tax Assessment Total Assessment is a certain percentage of the fair market value that is determined by local assessors to be the total taxable value of land and additions on the property. | Land | Improvement |
|---|---|---|---|---|
| 2025 | $2,203 | $489,500 | $148,100 | $341,400 |
| 2024 | $2,203 | $480,800 | $135,700 | $345,100 |
| 2023 | $2,052 | $470,400 | $135,700 | $334,700 |
| 2022 | $2,790 | $503,000 | $148,100 | $354,900 |
| 2021 | $2,944 | $374,900 | $86,300 | $288,600 |
| 2020 | $2,625 | $302,700 | $64,500 | $238,200 |
| 2019 | $2,906 | $281,100 | $58,000 | $223,100 |
| 2018 | $2,970 | $0 | $0 | $0 |
| 2017 | $2,497 | $0 | $0 | $0 |
| 2016 | $2,349 | $0 | $0 | $0 |
| 2015 | $2,175 | $0 | $0 | $0 |
| 2014 | $2,448 | $209,500 | $40,100 | $169,400 |
Source: Public Records
Map
Nearby Homes
- 2310 W Herron Loop
- 1525 S Herron Dr
- 12530 S Lenora Place
- Residence 14 Plan at Sagewater
- Residence 15 Plan at Sagewater
- Residence 13 Plan at Sagewater
- Residence 16 Plan at Sagewater
- 2084 W Cross Creek Dr
- 12322 S Essex Way
- 1915 W Aberdeen Ave
- 1011 S River Stone Dr
- 11223 Meadowbrook Dr
- 11150 W Troyer Dr
- 12343 Whitechapel Way
- 11300 Lake Lowell Ave
- TBD Lake Lowell Ave
- 1125 S Bonneville Dr
- 1986 W Ibis Dr
- 2095 W Ibis Dr
- 706 S Lancaster Dr
- 2225 W Herron Loop
- 2233 W Herron Loop
- Tbd Lake Ave
- 2221 W Herron Loop
- 2303 W Herron Loop
- 2220 W Herron Loop
- 2217 W Herron Loop
- 2307 W Herron Loop
- 2216 W Herron Loop
- 1445 S Spring Valley Dr
- 2213 W Herron Loop
- 1612 S Miller Way
- 2224 W Herron Loop
- 1618 S Miller Way
- 2311 W Herron Loop
- 2212 W Herron Loop
- 2209 W Herron Loop
- 1448 S Spring Valley Dr
- 1431 S Spring Valley Dr
- 2314 W Herron Loop