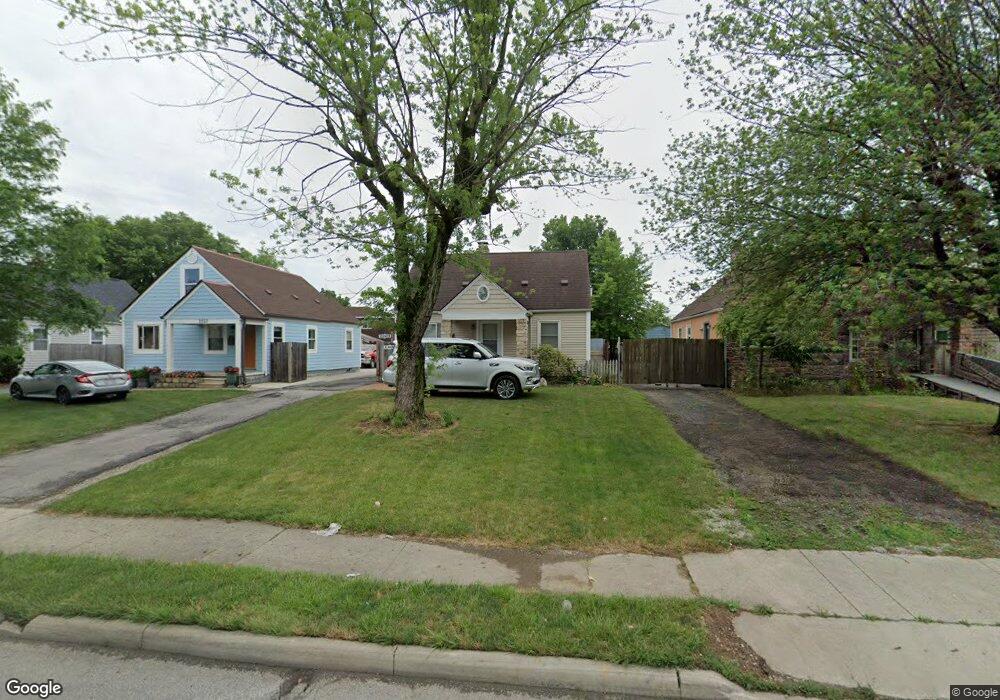
2229 W Mound St Columbus, OH 43223
South Central Hilltop NeighborhoodEstimated Value: $134,842 - $169,000
3
Beds
1
Bath
1,067
Sq Ft
$145/Sq Ft
Est. Value
About This Home
This home is located at 2229 W Mound St, Columbus, OH 43223 and is currently estimated at $154,711, approximately $144 per square foot. 2229 W Mound St is a home located in Franklin County with nearby schools including West Mound Elementary School, Hilltonia Middle School, and Briggs High School.
Ownership History
Date
Name
Owned For
Owner Type
Purchase Details
Closed on
Apr 22, 2002
Sold by
Bowers Kenneth R
Bought by
Garcia Plutarco G
Current Estimated Value
Home Financials for this Owner
Home Financials are based on the most recent Mortgage that was taken out on this home.
Original Mortgage
$69,351
Outstanding Balance
$29,405
Interest Rate
7.13%
Mortgage Type
FHA
Estimated Equity
$125,306
Purchase Details
Closed on
Sep 28, 2001
Sold by
Bowers Kenneth R
Bought by
Garcia Plutarco G
Home Financials for this Owner
Home Financials are based on the most recent Mortgage that was taken out on this home.
Original Mortgage
$65,900
Interest Rate
6.99%
Mortgage Type
Seller Take Back
Purchase Details
Closed on
Aug 20, 2001
Sold by
Collura Joseph J
Bought by
Bowers Kenneth R
Home Financials for this Owner
Home Financials are based on the most recent Mortgage that was taken out on this home.
Original Mortgage
$65,900
Interest Rate
6.99%
Mortgage Type
Seller Take Back
Purchase Details
Closed on
Aug 20, 1993
Bought by
Collura Joseph J
Create a Home Valuation Report for This Property
The Home Valuation Report is an in-depth analysis detailing your home's value as well as a comparison with similar homes in the area
Home Values in the Area
Average Home Value in this Area
Purchase History
| Date | Buyer | Sale Price | Title Company |
|---|---|---|---|
| Garcia Plutarco G | $69,900 | Independent Title | |
| Garcia Plutarco G | $69,900 | -- | |
| Bowers Kenneth R | $45,000 | Independent Title | |
| Collura Joseph J | -- | -- |
Source: Public Records
Mortgage History
| Date | Status | Borrower | Loan Amount |
|---|---|---|---|
| Open | Garcia Plutarco G | $69,351 | |
| Previous Owner | Garcia Plutarco G | $65,900 |
Source: Public Records
Tax History Compared to Growth
Tax History
| Year | Tax Paid | Tax Assessment Tax Assessment Total Assessment is a certain percentage of the fair market value that is determined by local assessors to be the total taxable value of land and additions on the property. | Land | Improvement |
|---|---|---|---|---|
| 2024 | $1,390 | $30,980 | $4,900 | $26,080 |
| 2023 | $1,373 | $30,975 | $4,900 | $26,075 |
| 2022 | $913 | $17,610 | $2,030 | $15,580 |
| 2021 | $915 | $17,610 | $2,030 | $15,580 |
| 2020 | $916 | $17,610 | $2,030 | $15,580 |
| 2019 | $871 | $14,350 | $1,680 | $12,670 |
| 2018 | $458 | $14,350 | $1,680 | $12,670 |
| 2017 | $870 | $14,350 | $1,680 | $12,670 |
| 2016 | $1,060 | $16,000 | $5,460 | $10,540 |
| 2015 | $505 | $16,000 | $5,460 | $10,540 |
| 2014 | $965 | $16,000 | $5,460 | $10,540 |
| 2013 | $559 | $18,795 | $6,405 | $12,390 |
Source: Public Records
Map
Nearby Homes
- 784-786 Butler Ave
- 611 Whitethorne Ave
- 2169 Amherst Ave
- 599 Whitethorne Ave
- 2188 Amherst Ave
- 693 S Wayne Ave
- 724 S Eureka Ave
- 545-547 S Highland Ave Unit 545
- 1033 Whitethorne Ave
- 558 S Oakley Ave Unit 60
- 640 S Eureka Ave
- 2375 Hardesty Dr N Unit A5
- 2367 Hardesty Dr N Unit 1-1
- 509 Belvidere Ave
- 2334 Hardesty Ct Unit 5
- 2354 Hardesty Ct Unit JA6
- 2322 Hardesty Ct Unit I11
- 485 Belvidere Ave
- 2205-2207 Sullivant Ave
- 651 S Terrace Ave
- 2235 W Mound St
- 2223 W Mound St
- 2217 W Mound St
- 2241 W Mound St
- 2211 W Mound St
- 2247 W Mound St
- 2205 W Mound St
- 2253 W Mound St
- 779 Clarendon Ave
- 2234 W Mound St
- 2226 W Mound St
- 2240 W Mound St
- 815 Clarendon Ave
- 2220 W Mound St
- 2252 Whitehead Rd
- 2242 Whitehead Rd
- 2246 W Mound St
- 2258 Whitehead Rd
- 2259 W Mound St