


223 All Saints Loop Pawleys Island, SC 29585
Estimated payment $5,410/month
Highlights
- Private Beach
- Gated Community
- Traditional Architecture
- Waccamaw Elementary School Rated A-
- Clubhouse
- Main Floor Bedroom
About This Home
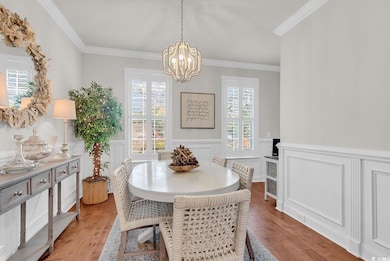
Litchfield Plantation is a stunningly beautiful and historic landmark situated on the Intracoastal Waterway. Also known as The Waccamaw River. As you enter the guard at Litchfield Plantation, you will see the magnificent "Avenue of Oaks" and feel as you are stepping back in time. Driving through the "Avenue Of Oaks" will be an experience that never gets old as you make your way to your residence located on a corner parcel. 223 All Saints Loop offers all you are looking for an updated and beautifully appointed home. This 4 bedroom, 3.5 bath home has two separate living areas, one upstairs along with 3 very large bedrooms upstairs. Plenty of storage with under stairs storage, finished garage has extra room for storage and pull down attic storage, all bathrooms have linen closets and 3 of the 4 bedrooms all have walk in closets. Beautiful outdoor space; screened in porch, oversized wood deck off the back of the house and a few oak trees that ties it all together. This home also features hand scraped wood style flooring throughout main living, predominantly all brick with a few Hardi plank accents on the back of the home, granite countertops, Kitchen Aid Professional series appliance package, shaker cabinets, subway tile backsplash, formal dining room with crown molding, Plantation shutters, whole house generator, balcony, gas propane fireplace and more. Amenities include a private beach House on Pawleys Island, a pool set among beautiful oak trees overlooking the Ricefields and gorgeous sunsets. There is also a small marina and a Historic Plantation house available for special occasions.
Home Details
Home Type
- Single Family
Year Built
- Built in 2018
Lot Details
- 10,019 Sq Ft Lot
- Private Beach
- Corner Lot
HOA Fees
- $252 Monthly HOA Fees
Parking
- 2 Car Attached Garage
- Side Facing Garage
- Garage Door Opener
Home Design
- Traditional Architecture
- Bi-Level Home
- Brick Exterior Construction
- Slab Foundation
- Tile
Interior Spaces
- 2,933 Sq Ft Home
- Crown Molding
- Tray Ceiling
- Ceiling Fan
- Plantation Shutters
- Insulated Doors
- Entrance Foyer
- Living Room with Fireplace
- Formal Dining Room
- Screened Porch
- Carpet
- Fire and Smoke Detector
Kitchen
- Breakfast Bar
- Range
- Microwave
- Dishwasher
- Stainless Steel Appliances
- Kitchen Island
- Solid Surface Countertops
- Disposal
Bedrooms and Bathrooms
- 4 Bedrooms
- Main Floor Bedroom
Laundry
- Laundry Room
- Washer and Dryer Hookup
Outdoor Features
- Patio
Schools
- Waccamaw Elementary School
- Waccamaw Middle School
- Waccamaw High School
Utilities
- Central Heating and Cooling System
- Underground Utilities
- Water Heater
- Cable TV Available
Community Details
Overview
- Association fees include pool service, common maint/repair, security, recreation facilities
- The community has rules related to allowable golf cart usage in the community
Recreation
- Community Pool
Additional Features
- Clubhouse
- Gated Community
Map
Home Values in the Area
Average Home Value in this Area
Tax History
| Year | Tax Paid | Tax Assessment Tax Assessment Total Assessment is a certain percentage of the fair market value that is determined by local assessors to be the total taxable value of land and additions on the property. | Land | Improvement |
|---|---|---|---|---|
| 2024 | $3,564 | $27,770 | $5,000 | $22,770 |
| 2023 | $3,564 | $27,770 | $5,000 | $22,770 |
| 2022 | $2,344 | $19,650 | $3,000 | $16,650 |
| 2021 | $2,270 | $19,652 | $3,000 | $16,652 |
| 2020 | $2,264 | $19,652 | $3,000 | $16,652 |
| 2019 | $2,083 | $18,192 | $2,904 | $15,288 |
| 2018 | $1,282 | $106,080 | $0 | $0 |
| 2017 | $916 | $0 | $0 | $0 |
| 2016 | $910 | $4,350 | $0 | $0 |
| 2015 | $1,810 | $0 | $0 | $0 |
| 2014 | $1,810 | $150,000 | $150,000 | $0 |
| 2012 | -- | $150,000 | $150,000 | $0 |
Property History
| Date | Event | Price | List to Sale | Price per Sq Ft |
|---|---|---|---|---|
| 10/02/2025 10/02/25 | Price Changed | $925,000 | -2.6% | $315 / Sq Ft |
| 08/26/2025 08/26/25 | For Sale | $950,000 | -- | $324 / Sq Ft |
Purchase History
| Date | Type | Sale Price | Title Company |
|---|---|---|---|
| Deed | $745,000 | -- | |
| Special Warranty Deed | $977,000 | None Available | |
| Deed | $571,500 | -- |
Mortgage History
| Date | Status | Loan Amount | Loan Type |
|---|---|---|---|
| Open | $338,627 | New Conventional |
Source: Coastal Carolinas Association of REALTORS®
MLS Number: 2521926
APN: 04-0184A-024-25-00
Disclaimer: Certain information contained herein is derived from information provided by parties other than Homes.com. All information provided is deemed reliable, but is not guaranteed to be accurate and should be independently verified.
![]() Provided courtesy of the Coastal Carolinas MLS. Copyright 2025 of the Coastal Carolinas MLS. All rights reserved. Information is provided exclusively for consumers' personal, non-commercial use, and may not be used for any purpose other than to identify prospective properties consumers may be interested in purchasing, and that the data is deemed reliable but is not guaranteed accurate by the Coastal Carolinas MLS.
Provided courtesy of the Coastal Carolinas MLS. Copyright 2025 of the Coastal Carolinas MLS. All rights reserved. Information is provided exclusively for consumers' personal, non-commercial use, and may not be used for any purpose other than to identify prospective properties consumers may be interested in purchasing, and that the data is deemed reliable but is not guaranteed accurate by the Coastal Carolinas MLS.
- 287 All Saints Loop Unit Lot 1
- 202 Spreading Oak Dr
- 72 Landing Rd
- 87 Vineyard Place Unit 34
- 99 Vineyard Place Unit 32
- 129 Vineyard Place Unit 129
- 40 Millbranch Ln Unit Lot 45 The Pointe
- 55 Cabaniss Ln
- 396 Tuckers Rd Unit 3C
- 840 Aspen Loop
- 151 Angel Oak Dr Unit Waverly Creek
- 118 Oatland Lake Rd
- 1521 Hawthorn Dr
- 1464 Hawthorn Dr Unit LCC 16
- 118 Goodson Loop Unit Lot 5 Litchfield Cou
- 133 Goodson Loop Unit Litchfield Country C
- 55 Beaver Pond Loop Unit 15
- 313 Rossdhu Ave
- 86 Beaver Pond Loop Unit 33
- 108 Beaver Pond Loop Unit 42
- 33 Golf View Ct Unit River Club
- 177 Club Cir Unit 1-14
- 393 Aspen Loop Unit ID1253451P
- 178 Beaver Pond Loop Unit 60
- 176 Old Cedar Loop Unit ID1253452P
- 911 Algonquin Dr Unit Pawleys Pavilion 911
- 1025 Algonquin Dr Unit 1025G Pawleys Pavilion
- 390 Pinehurst Ln Unit ID1253447P
- 342 Pinehurst Ln Unit ID1253372P
- 270 Pinehurst Ln Unit ID1253774P
- 72 Haint Place Unit Magnolia Beach West
- 29 Wimbledon Ct Unit 8
- 84 Racquet Club Dr Unit WVC 14
- 568 Pinehurst Ln Unit ID1370709P
- 22 Greenbriar Ave Unit ID1253400P
- 117 Pinehurst Ln Unit ID1253381P
- 292 Clearwater Dr
- 80 Pinehurst Ln Unit ID1253416P
- 13160 Ocean Hwy Unit ID1253468P
- 5 Ashcraft Cir
