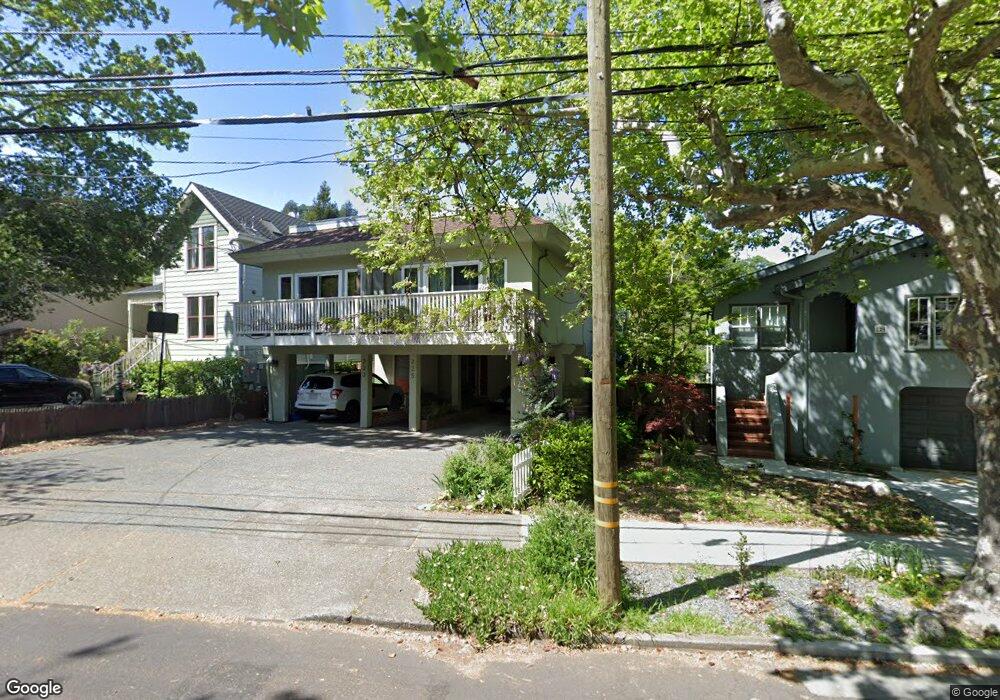
223 C St San Rafael, CA 94901
Gerstle Park NeighborhoodEstimated Value: $1,235,000 - $1,757,000
6
Beds
3
Baths
3,256
Sq Ft
$453/Sq Ft
Est. Value
About This Home
This home is located at 223 C St, San Rafael, CA 94901 and is currently estimated at $1,473,441, approximately $452 per square foot. 223 C St is a home located in Marin County with nearby schools including Laurel Dell Elementary School, James B. Davidson Middle School, and San Rafael High School.
Ownership History
Date
Name
Owned For
Owner Type
Purchase Details
Closed on
Nov 21, 2017
Sold by
Timossi Christopher
Bought by
Vivi Lori Ann
Current Estimated Value
Purchase Details
Closed on
Apr 4, 2017
Sold by
Lennon Deborah
Bought by
Livin Lennon Deborah and Livin Deborah Lennon Revocable
Purchase Details
Closed on
Jul 6, 2015
Sold by
Timossi Christopher A and Lennon Deborah
Bought by
Timossi Christopher A and Lennon Deborah
Purchase Details
Closed on
May 27, 2009
Sold by
Timossi James A
Bought by
James Timossi Revocable Trust
Create a Home Valuation Report for This Property
The Home Valuation Report is an in-depth analysis detailing your home's value as well as a comparison with similar homes in the area
Home Values in the Area
Average Home Value in this Area
Purchase History
| Date | Buyer | Sale Price | Title Company |
|---|---|---|---|
| Vivi Lori Ann | -- | None Available | |
| Livin Lennon Deborah | -- | None Available | |
| Timossi Christopher A | -- | None Available | |
| James Timossi Revocable Trust | -- | None Available |
Source: Public Records
Tax History Compared to Growth
Tax History
| Year | Tax Paid | Tax Assessment Tax Assessment Total Assessment is a certain percentage of the fair market value that is determined by local assessors to be the total taxable value of land and additions on the property. | Land | Improvement |
|---|---|---|---|---|
| 2025 | $8,083 | $397,787 | $116,227 | $281,560 |
| 2024 | $8,083 | $389,988 | $113,948 | $276,040 |
| 2023 | $7,804 | $382,342 | $111,714 | $270,628 |
| 2022 | $7,481 | $374,846 | $109,524 | $265,322 |
| 2021 | $7,372 | $367,497 | $107,377 | $260,120 |
| 2020 | $7,277 | $363,731 | $106,276 | $257,455 |
| 2019 | $6,832 | $356,601 | $104,193 | $252,408 |
| 2018 | $6,769 | $349,610 | $102,150 | $247,460 |
| 2017 | $6,568 | $342,755 | $100,147 | $242,608 |
| 2016 | $6,174 | $321,316 | $98,178 | $223,138 |
| 2015 | $5,909 | $316,490 | $96,703 | $219,787 |
| 2014 | $5,618 | $310,291 | $94,809 | $215,482 |
Source: Public Records
Map
Nearby Homes