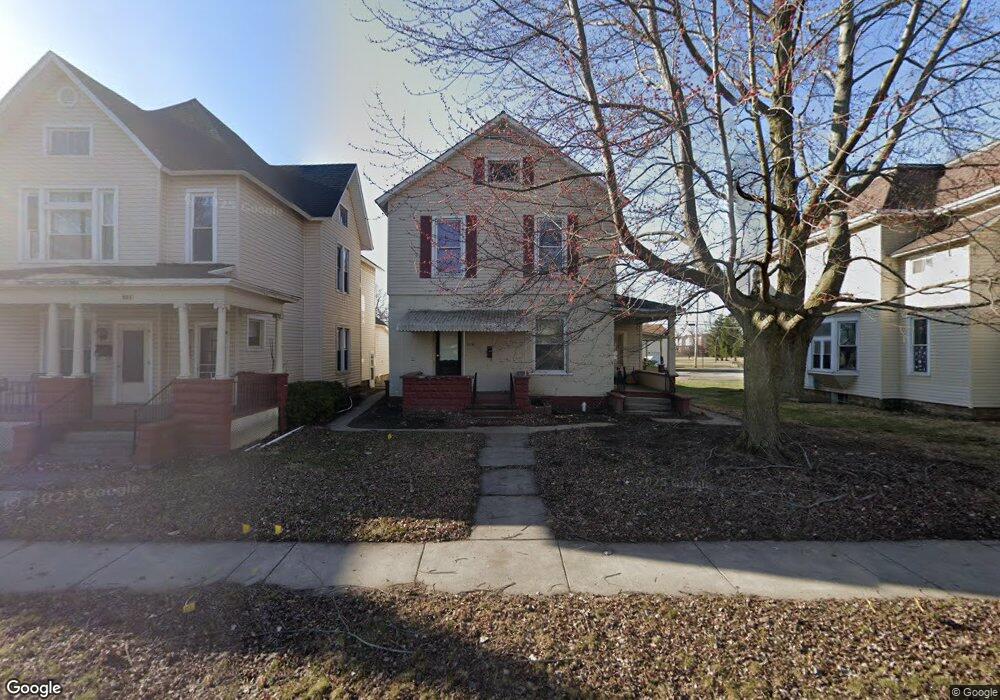
223 Center St Findlay, OH 45840
Estimated Value: $155,694 - $192,000
1
Bed
3
Baths
900
Sq Ft
$193/Sq Ft
Est. Value
About This Home
Property Id: 1100626
Could be used as a 2 bedroom. NO SMOKING inside. Located near downtown. Must pass a background check and have zero felonies or drug charges. Must have prior landlord references or have a co signer. Income must be at least 3x the rent amount. If interested, please fill out the pre screener or you will not be contacted. Absolutely no prior evictions. Landlord pays water, sewer and trash. Heat is gas. Pets permitted upon approval. Additional fees and policy apply. If serious please text me at .
Ownership History
Date
Name
Owned For
Owner Type
Purchase Details
Closed on
Jan 18, 2023
Sold by
Stellar Rentals Llc
Bought by
Boogie Farms Llc
Current Estimated Value
Home Financials for this Owner
Home Financials are based on the most recent Mortgage that was taken out on this home.
Original Mortgage
$559,636
Outstanding Balance
$519,155
Interest Rate
6.33%
Mortgage Type
New Conventional
Estimated Equity
-$345,231
Purchase Details
Closed on
Feb 26, 2021
Sold by
Rayle Rentals Llc
Bought by
Stellar Rentals Llc
Purchase Details
Closed on
Dec 20, 1991
Bought by
Rayle Gary L and Rayle Sharon
Create a Home Valuation Report for This Property
The Home Valuation Report is an in-depth analysis detailing your home's value as well as a comparison with similar homes in the area
Home Values in the Area
Average Home Value in this Area
Purchase History
| Date | Buyer | Sale Price | Title Company |
|---|---|---|---|
| Boogie Farms Llc | -- | Golden Key Title | |
| Stellar Rentals Llc | $165,000 | Flag City Title Agency Inc | |
| Rayle Gary L | $75,000 | -- |
Source: Public Records
Mortgage History
| Date | Status | Borrower | Loan Amount |
|---|---|---|---|
| Open | Boogie Farms Llc | $559,636 |
Source: Public Records
Property History
| Date | Event | Price | List to Sale | Price per Sq Ft |
|---|---|---|---|---|
| 03/11/2025 03/11/25 | Off Market | $850 | -- | -- |
| 02/26/2025 02/26/25 | For Rent | $850 | -- | -- |
Tax History Compared to Growth
Tax History
| Year | Tax Paid | Tax Assessment Tax Assessment Total Assessment is a certain percentage of the fair market value that is determined by local assessors to be the total taxable value of land and additions on the property. | Land | Improvement |
|---|---|---|---|---|
| 2024 | $1,647 | $45,190 | $5,270 | $39,920 |
| 2023 | $3,351 | $59,690 | $5,270 | $54,420 |
| 2022 | $1,644 | $45,190 | $5,270 | $39,920 |
| 2021 | $1,495 | $35,780 | $5,540 | $30,240 |
| 2020 | $1,494 | $35,780 | $5,540 | $30,240 |
| 2019 | $1,465 | $35,780 | $5,540 | $30,240 |
| 2018 | $1,526 | $34,200 | $3,960 | $30,240 |
| 2017 | $763 | $34,200 | $3,960 | $30,240 |
| 2016 | $1,513 | $34,200 | $3,960 | $30,240 |
| 2015 | $1,400 | $31,120 | $4,740 | $26,380 |
| 2014 | $1,400 | $31,120 | $4,740 | $26,380 |
| 2012 | $1,701 | $37,540 | $2,570 | $34,970 |
Source: Public Records
Map
Nearby Homes
- 213 Cherry St
- 0 Canadian Way Unit 20253551
- 0 Canadian Way Unit 6135400
- 523 Center St
- 512 N Cory St
- 207 Ash Ave
- 545 Clinton Ct
- 407 Washington St
- 224 Defiance Ave
- 247 Crystal Ave
- 706 N Cory St
- 514 Liberty St
- 210 Western Ave
- 115 George St
- 210 Eastowne Park Row
- 720 S West St
- 419 W Lincoln St
- 817 Park St
- 829 Maple Ave
- 524 Defiance Ave
- 223 Center St Unit 1
- 223 Center St Unit 3
- 225 Center St Unit half
- 216 Taylor St
- 215 Center St
- 229 Center St Unit A
- 229 Center St
- 211 Center St
- 210 Taylor St
- 232 Center St
- 207 Center St
- 206 Taylor St
- 0 Taylor St Unit H136027
- 0 Taylor St
- 204 Taylor St
- 201 Center St
- 215 Clinton St Unit 217
- 221 Clinton St
- 228 Center St
- 206 Center St