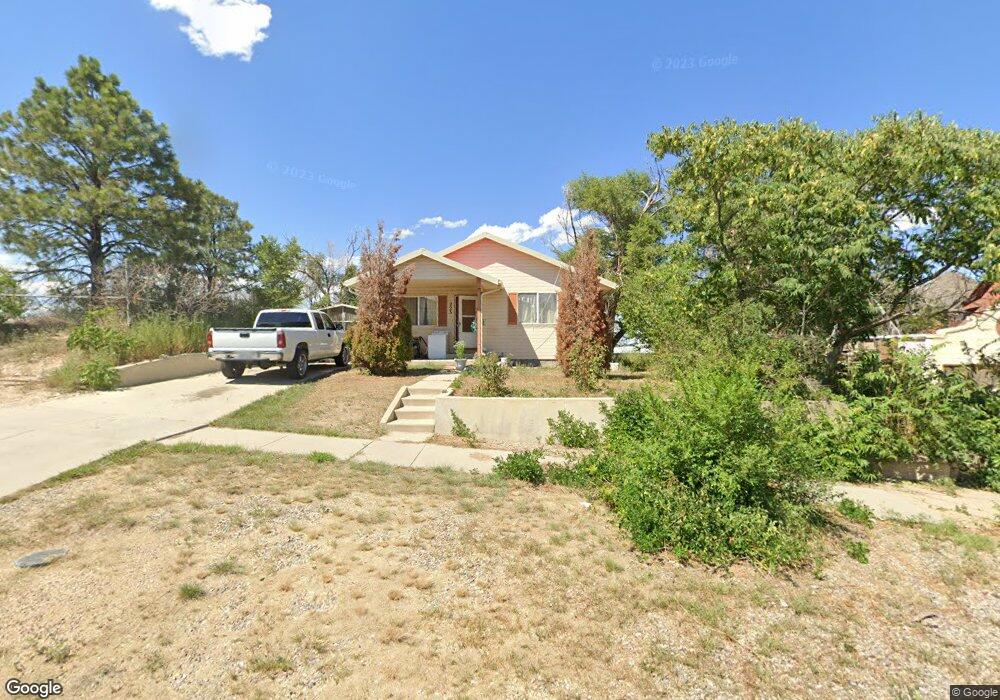
223 E 3rd St Pueblo, CO 81003
Downtown NeighborhoodEstimated Value: $143,000 - $261,000
2
Beds
1
Bath
935
Sq Ft
$196/Sq Ft
Est. Value
About This Home
This home is located at 223 E 3rd St, Pueblo, CO 81003 and is currently estimated at $183,139, approximately $195 per square foot. 223 E 3rd St is a home located in Pueblo County with nearby schools including Bradford Elementary School, Risley International Academy of Innovation, and Centennial High School.
Ownership History
Date
Name
Owned For
Owner Type
Purchase Details
Closed on
Jul 9, 2004
Sold by
Colo Housing + Finance Auth
Bought by
Adame Esquivel Enrique
Current Estimated Value
Purchase Details
Closed on
Jan 22, 2004
Sold by
Rusovick Jolene R
Bought by
Colo Housing + Finance Auth
Purchase Details
Closed on
Sep 18, 2003
Sold by
Gilmore Michael L
Bought by
Rusovick Jolene R
Purchase Details
Closed on
Aug 7, 2003
Sold by
Rusovick Jolene R
Bought by
Gilmore Michael L
Purchase Details
Closed on
Dec 29, 1999
Sold by
Neighborhood Housing Services
Bought by
Rusovick Jolene R
Purchase Details
Closed on
Jan 8, 1999
Sold by
Kelly W Bret
Bought by
Neighborhood Housing Services
Purchase Details
Closed on
Nov 25, 1985
Sold by
Ventures Inc
Bought by
Kelly W Bret
Purchase Details
Closed on
Oct 14, 1983
Bought by
Ventures Inc
Purchase Details
Closed on
May 2, 1979
Bought by
Post Harold F
Purchase Details
Closed on
Jan 18, 1978
Bought by
Serracino Gus + Virginia E
Create a Home Valuation Report for This Property
The Home Valuation Report is an in-depth analysis detailing your home's value as well as a comparison with similar homes in the area
Home Values in the Area
Average Home Value in this Area
Purchase History
| Date | Buyer | Sale Price | Title Company |
|---|---|---|---|
| Adame Esquivel Enrique | $64,000 | -- | |
| Colo Housing + Finance Auth | -- | -- | |
| Rusovick Jolene R | -- | -- | |
| Gilmore Michael L | -- | -- | |
| Rusovick Jolene R | $69,000 | -- | |
| Neighborhood Housing Services | -- | -- | |
| Kelly W Bret | -- | -- | |
| Ventures Inc | $500 | -- | |
| Post Harold F | -- | -- | |
| Serracino Gus + Virginia E | $5,000 | -- |
Source: Public Records
Tax History
| Year | Tax Paid | Tax Assessment Tax Assessment Total Assessment is a certain percentage of the fair market value that is determined by local assessors to be the total taxable value of land and additions on the property. | Land | Improvement |
|---|---|---|---|---|
| 2024 | $725 | $7,360 | -- | -- |
| 2023 | $734 | $11,050 | $1,010 | $10,040 |
| 2022 | $886 | $8,920 | $180 | $8,740 |
| 2021 | $915 | $9,190 | $190 | $9,000 |
| 2020 | $618 | $8,540 | $190 | $8,350 |
| 2019 | $618 | $6,125 | $114 | $6,011 |
| 2018 | $439 | $4,840 | $114 | $4,726 |
| 2017 | $443 | $4,840 | $114 | $4,726 |
| 2016 | $407 | $4,474 | $127 | $4,347 |
| 2015 | $405 | $4,474 | $127 | $4,347 |
| 2014 | $435 | $4,800 | $127 | $4,673 |
Source: Public Records
Map
Nearby Homes
- 225 N Bradford Ave
- 211 W 2nd St
- 224 W 3rd St
- 224 - 228 W 3rd St Unit 7
- 221 E 4th St Unit 223
- 615 E 1st St
- 102 S Union Ave Unit 205
- 711 E 3rd St
- 829 E 3rd St
- 812 E 6th St
- 229 W Riverwalk
- 229 W Riverwalk Unit Suite 204
- 231 W Riverwalk Unit 5
- 235 W Riverwalk Unit 7
- 711 N Glendale Ave
- 102 S Victoria Ave
- 805 E 7th St
- 904 E 1st St
- 510 W 7th St
- 915 E River St
- 303 N Bradford Ave
- 305 N Bradford Ave
- 305 N Bradford St
- 307 N Bradford St
- 224 E 4th St
- 224 E 3rd St
- 216 E 3rd St
- 220 E 3rd St
- 210 E 3rd St
- 225 N Bradford St
- 219 N Bradford Ave
- 217 N Bradford St
- 209 N Bradford Ave
- 217 E 2nd St
- 219 E 2nd St Unit A&B
- 221 E 2nd St
- 300 E 3rd St
- 300 E 3rd St Unit 10
- 225 E 4th St
- 220 N Bradford Ave
Your Personal Tour Guide
Ask me questions while you tour the home.