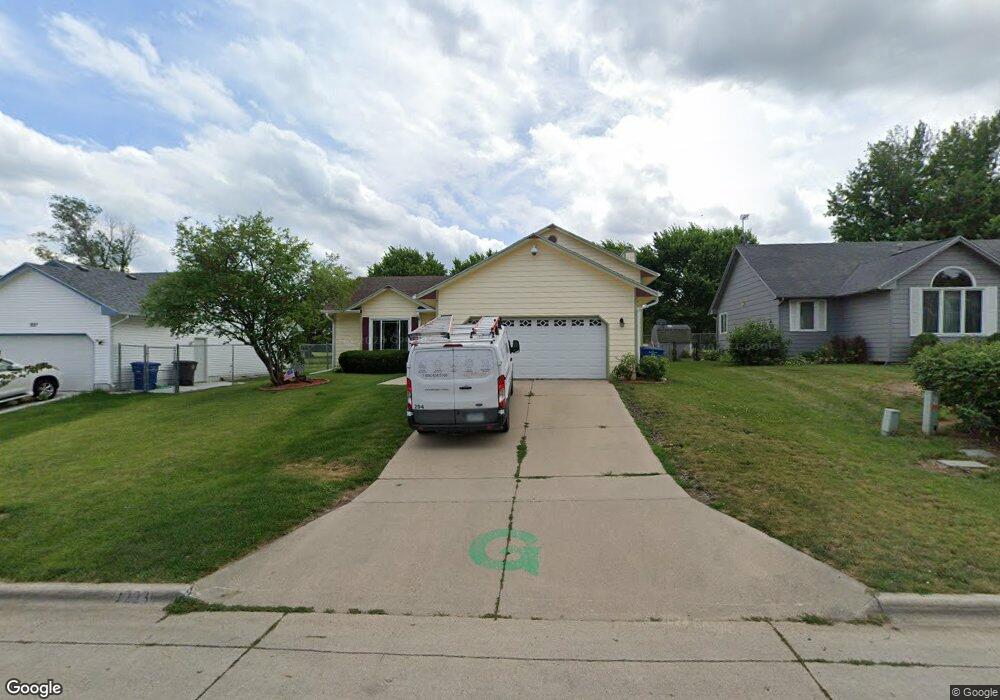
223 E Burnham Ave Des Moines, IA 50315
Estimated Value: $258,000 - $291,000
4
Beds
3
Baths
1,227
Sq Ft
$224/Sq Ft
Est. Value
About This Home
This home is located at 223 E Burnham Ave, Des Moines, IA 50315 and is currently estimated at $274,845, approximately $223 per square foot. 223 E Burnham Ave is a home located in Polk County with nearby schools including Morris Elementary School, Mccombs Middle School, and Lincoln High School.
Ownership History
Date
Name
Owned For
Owner Type
Purchase Details
Closed on
Dec 21, 2005
Sold by
Castelline Paul R
Bought by
Osborne Sean M and Osborne Shawn L
Current Estimated Value
Home Financials for this Owner
Home Financials are based on the most recent Mortgage that was taken out on this home.
Original Mortgage
$38,000
Outstanding Balance
$21,500
Interest Rate
6.48%
Mortgage Type
Fannie Mae Freddie Mac
Estimated Equity
$253,345
Purchase Details
Closed on
Aug 21, 2002
Sold by
Kellner Tony J and Kellner Jolene F
Bought by
Castelline Paul R
Home Financials for this Owner
Home Financials are based on the most recent Mortgage that was taken out on this home.
Original Mortgage
$75,000
Interest Rate
6.63%
Create a Home Valuation Report for This Property
The Home Valuation Report is an in-depth analysis detailing your home's value as well as a comparison with similar homes in the area
Home Values in the Area
Average Home Value in this Area
Purchase History
| Date | Buyer | Sale Price | Title Company |
|---|---|---|---|
| Osborne Sean M | $155,500 | Itc | |
| Castelline Paul R | $137,500 | -- |
Source: Public Records
Mortgage History
| Date | Status | Borrower | Loan Amount |
|---|---|---|---|
| Open | Osborne Sean M | $38,000 | |
| Previous Owner | Castelline Paul R | $75,000 |
Source: Public Records
Tax History Compared to Growth
Tax History
| Year | Tax Paid | Tax Assessment Tax Assessment Total Assessment is a certain percentage of the fair market value that is determined by local assessors to be the total taxable value of land and additions on the property. | Land | Improvement |
|---|---|---|---|---|
| 2025 | $4,698 | $286,300 | $50,200 | $236,100 |
| 2024 | $4,698 | $249,300 | $43,200 | $206,100 |
| 2023 | $4,432 | $249,300 | $43,200 | $206,100 |
| 2022 | $4,396 | $196,900 | $35,100 | $161,800 |
| 2021 | $4,388 | $196,900 | $35,100 | $161,800 |
| 2020 | $4,552 | $184,400 | $32,800 | $151,600 |
| 2019 | $4,620 | $184,400 | $32,800 | $151,600 |
| 2018 | $4,568 | $180,400 | $31,100 | $149,300 |
| 2017 | $4,344 | $180,400 | $31,100 | $149,300 |
| 2016 | $4,226 | $169,100 | $28,600 | $140,500 |
| 2015 | $4,226 | $169,100 | $28,600 | $140,500 |
| 2014 | $3,840 | $158,900 | $26,600 | $132,300 |
Source: Public Records
Map
Nearby Homes
- 217 E Payton Ave
- 313 E Payton Ave
- 214 Leland Ave
- 243 Hart Ave
- 6204 SW 5th St
- 613 Cummins Rd
- 5936 SW 2nd St
- 401 E Wall Ave
- 528 Hart Ave
- 154 Crossroads Dr
- 7807 SE 2nd St
- 8 E Wall Ave
- 325 E Porter Ave
- 5812 SW 5th St
- 5600 SE 4th St
- 5612 SW 2nd St
- 439 E Porter Ave
- 508 Wall Ave
- 7500 SE Bloomfield Rd Unit 40
- 500 E County Line Rd
- 227 E Burnham Ave
- 219 E Burnham Ave
- 231 E Burnham Ave
- 215 E Burnham Ave
- 218 E Burnham Ave
- 222 E Burnham Ave
- 6721 SE 2nd Ct
- 235 E Burnham Ave
- 6720 SE 3rd St
- 6711 SE 2nd Ct
- 6710 SE 3rd St
- 301 E Burnham Ave
- 219 E Bundy Ave
- 223 E Bundy Ave
- 6806 SE 2nd Ct
- 6800 SE 2nd Ct
- 6724 SE 2nd Ct
- 6701 SE 2nd Ct
- 300 E Burnham Ave
- 6700 SE 3rd St