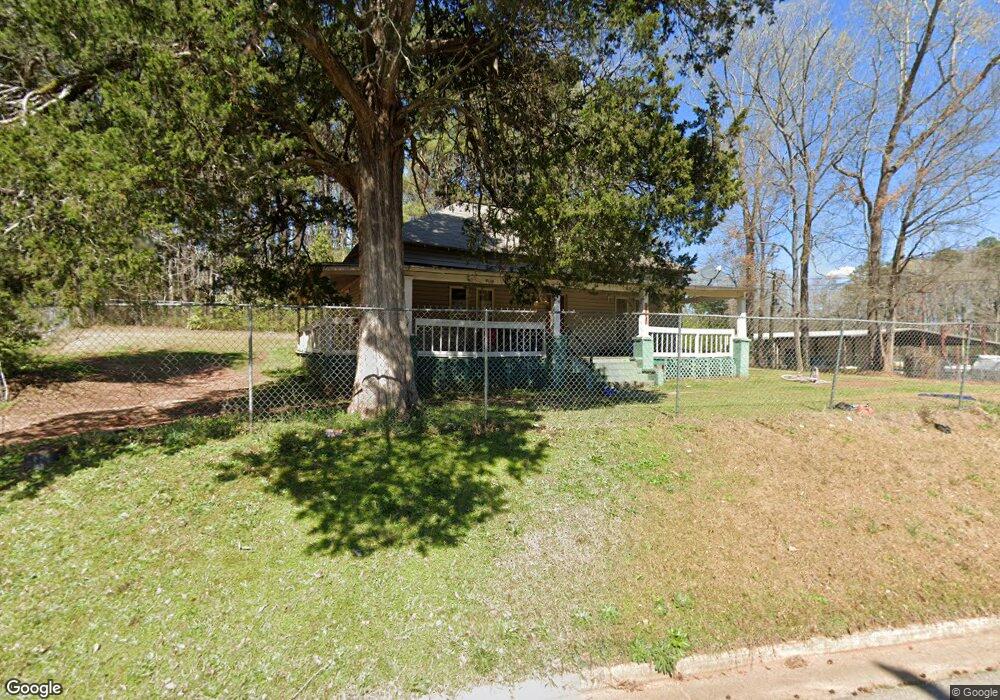
223 E Render St Lagrange, GA 30241
Estimated Value: $83,000 - $127,000
3
Beds
1
Bath
1,102
Sq Ft
$104/Sq Ft
Est. Value
About This Home
This home is located at 223 E Render St, Lagrange, GA 30241 and is currently estimated at $114,526, approximately $103 per square foot. 223 E Render St is a home located in Troup County with nearby schools including Hollis Hand Elementary School, Franklin Forest Elementary School, and Ethel W. Kight Elementary School.
Ownership History
Date
Name
Owned For
Owner Type
Purchase Details
Closed on
Dec 28, 2005
Sold by
Rodgers Willie Dean
Bought by
Cosper Realty Llc
Current Estimated Value
Purchase Details
Closed on
Aug 21, 1985
Sold by
Rogers Sandra Sue
Bought by
Ophelia M Rogers
Purchase Details
Closed on
Feb 25, 1981
Sold by
Rogers Sue
Bought by
Rogers Sandra Sue
Purchase Details
Closed on
Mar 3, 1978
Sold by
Gallant James G
Bought by
Rogers Sue
Purchase Details
Closed on
Jul 22, 1977
Sold by
Gallant Louise Ramsey
Bought by
Gallant James G
Purchase Details
Closed on
Mar 13, 1977
Sold by
Rogers Sammy
Bought by
Gallant Louise Ramsey
Purchase Details
Closed on
Jun 8, 1976
Sold by
Brown M L
Bought by
Rogers Sammy
Purchase Details
Closed on
Jan 1, 1952
Sold by
Mobley Morelan-No Deed Bk and Mobley Page
Bought by
Brown M L
Create a Home Valuation Report for This Property
The Home Valuation Report is an in-depth analysis detailing your home's value as well as a comparison with similar homes in the area
Purchase History
| Date | Buyer | Sale Price | Title Company |
|---|---|---|---|
| Cosper Realty Llc | $95,000 | -- | |
| Ophelia M Rogers | -- | -- | |
| Rogers Sandra Sue | -- | -- | |
| Rogers Sue | $3,700 | -- | |
| Gallant James G | -- | -- | |
| Gallant Louise Ramsey | -- | -- | |
| Rogers Sammy | -- | -- | |
| Brown M L | -- | -- |
Source: Public Records
Tax History
| Year | Tax Paid | Tax Assessment Tax Assessment Total Assessment is a certain percentage of the fair market value that is determined by local assessors to be the total taxable value of land and additions on the property. | Land | Improvement |
|---|---|---|---|---|
| 2025 | $742 | $28,400 | $9,480 | $18,920 |
| 2024 | $742 | $27,200 | $9,480 | $17,720 |
| 2023 | $703 | $25,760 | $9,480 | $16,280 |
| 2022 | $683 | $24,480 | $9,480 | $15,000 |
| 2021 | $671 | $22,240 | $4,720 | $17,520 |
| 2020 | $671 | $22,240 | $4,720 | $17,520 |
| 2019 | $616 | $20,440 | $4,720 | $15,720 |
| 2018 | $605 | $20,072 | $4,632 | $15,440 |
| 2017 | $605 | $20,072 | $4,632 | $15,440 |
| 2016 | $598 | $19,837 | $4,632 | $15,205 |
| 2015 | $599 | $19,837 | $4,632 | $15,205 |
| 2014 | $576 | $19,037 | $4,632 | $14,405 |
| 2013 | -- | $19,981 | $4,632 | $15,349 |
Source: Public Records
Map
Nearby Homes
- 605 E Render St
- 221 E Render St
- 230 E Render St
- 226 E Render St
- 224 E Render St
- 222 E Render St
- 225 E Render St
- 115 Gallant St
- 117 Gallant St
- 217 E Render St
- 220 E Render St
- E Render Pkwy NE
- E Render Pkwy
- 111 Gallant St
- 236 E Render St
- 109 Gallant St
- 218 E Render St
- 107 Gallant St
- 216 E Render St
- 238 E Render St
Your Personal Tour Guide
Ask me questions while you tour the home.