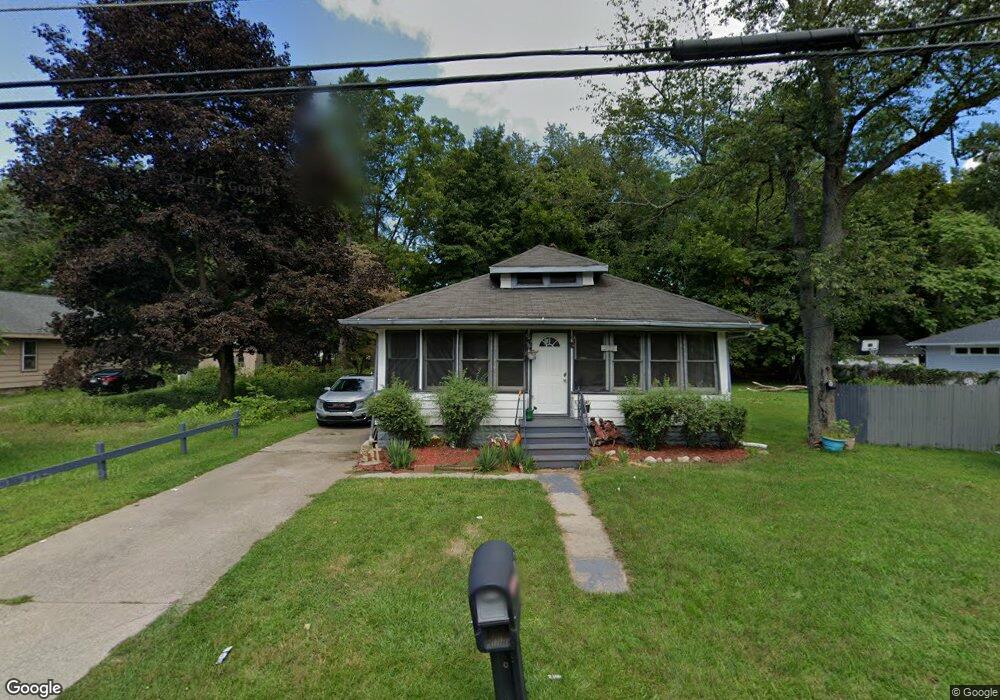
223 Eastern Ave Benton Harbor, MI 49022
Fair Plain NeighborhoodEstimated Value: $147,000 - $158,000
2
Beds
1
Bath
1,044
Sq Ft
$146/Sq Ft
Est. Value
About This Home
This home is located at 223 Eastern Ave, Benton Harbor, MI 49022 and is currently estimated at $152,627, approximately $146 per square foot. 223 Eastern Ave is a home located in Berrien County with nearby schools including Fair Plain Middle School, Benton Harbor High School, and Benton Harbor Charter School Academy.
Ownership History
Date
Name
Owned For
Owner Type
Purchase Details
Closed on
Jul 21, 2023
Sold by
Merriweather Janice and Perry Theron D
Bought by
Perry Ashanti Dashai and Merriweather Janice
Current Estimated Value
Purchase Details
Closed on
May 21, 2014
Sold by
Merriweather Janice
Bought by
Merriweather Janice and Perry Theron
Purchase Details
Closed on
Jul 30, 2013
Sold by
Perry Richard A and Bell Angelique
Bought by
Merriweather Janice
Purchase Details
Closed on
Apr 12, 2011
Sold by
Merriweather Janice
Bought by
Perry Richard A and Bell Angelique
Purchase Details
Closed on
Jun 2, 2008
Sold by
Phillips Sylvia Marie Ann
Bought by
Perry Theron Darrell
Purchase Details
Closed on
Apr 21, 2006
Sold by
Merriweather Janice
Bought by
Perry Theron and Merriweather Janice
Purchase Details
Closed on
Sep 15, 2005
Sold by
Meadows Mildred E and Meadows Michael
Bought by
Household Finance Corp Iii
Purchase Details
Closed on
Mar 19, 1998
Purchase Details
Closed on
Apr 28, 1987
Create a Home Valuation Report for This Property
The Home Valuation Report is an in-depth analysis detailing your home's value as well as a comparison with similar homes in the area
Home Values in the Area
Average Home Value in this Area
Purchase History
| Date | Buyer | Sale Price | Title Company |
|---|---|---|---|
| Perry Ashanti Dashai | -- | None Listed On Document | |
| Perry Ashanti Dashai | -- | None Listed On Document | |
| Merriweather Janice | -- | None Available | |
| Merriweather Janice | -- | None Available | |
| Perry Richard A | -- | None Available | |
| Perry Theron Darrell | -- | None Available | |
| Perry Theron | -- | Meridian Title Corporation | |
| Household Finance Corp Iii | $60,720 | -- | |
| -- | $19,800 | -- | |
| -- | $19,800 | -- |
Source: Public Records
Tax History
| Year | Tax Paid | Tax Assessment Tax Assessment Total Assessment is a certain percentage of the fair market value that is determined by local assessors to be the total taxable value of land and additions on the property. | Land | Improvement |
|---|---|---|---|---|
| 2025 | $1,293 | $56,300 | $0 | $0 |
| 2024 | $691 | $51,600 | $0 | $0 |
| 2023 | $658 | $50,400 | $0 | $0 |
| 2022 | $627 | $48,500 | $0 | $0 |
| 2021 | $1,138 | $44,900 | $2,100 | $42,800 |
| 2020 | $1,122 | $44,900 | $0 | $0 |
| 2019 | $1,109 | $33,900 | $1,500 | $32,400 |
| 2018 | $1,073 | $33,900 | $0 | $0 |
| 2017 | $1,061 | $33,600 | $0 | $0 |
| 2016 | $1,030 | $33,000 | $0 | $0 |
| 2015 | $1,027 | $33,800 | $0 | $0 |
| 2014 | $532 | $31,100 | $0 | $0 |
Source: Public Records
Map
Nearby Homes
- 180 Emery Ave
- 1593 Columbus Ave
- V/L Mcalister
- 1238 Broadway
- 1298 Colfax Ave
- 1216 Broadway
- 1250 Superior St
- 1156 Mc Alister Ave
- 298 Bradford Rd
- 1342 Monroe St
- 1712 W Ogden Cir
- 1096 Pearl St
- 379 Western Ave
- 1190 Monroe St
- 1772 Lombard St
- 161 Eloise Dr
- 1064 Ogden Ave
- 979 Lavette Ave
- 973 Lavette Ave
- 1968 Colfax Ave
- 207 Eastern Ave
- 224 Eastern Ave
- 208 Eastern Ave
- 235 Eastern Ave
- 240 Eastern Ave
- 240 Eastern Ave
- 244 Eastern Ave
- 203 Eastern Ave
- 250 Eastern Ave
- 257 Eastern Ave
- 192 Eastern Ave
- 185 Eastern Ave
- 264 Eastern Ave
- 175 Eastern Ave
- 273 Eastern Ave
- 274 Eastern Ave
- 222 Orchard Ln
- 234 Orchard Ln
- 208 Orchard Ln
- 161 Eastern Ave
Your Personal Tour Guide
Ask me questions while you tour the home.