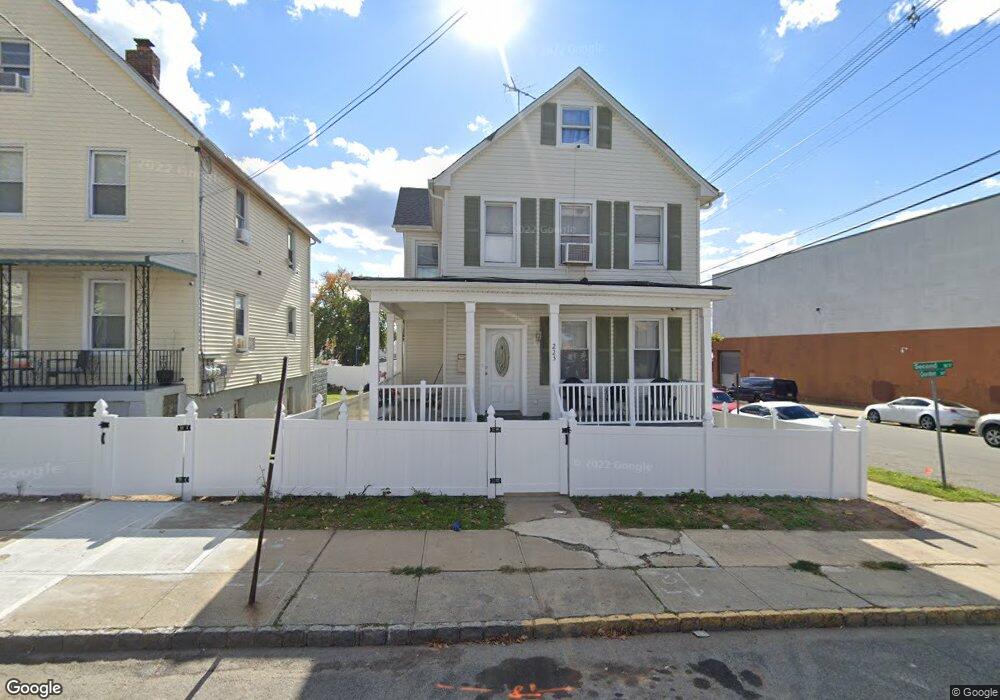
223 Gordon St Perth Amboy, NJ 08861
The Waterfront NeighborhoodEstimated Value: $434,553 - $523,000
--
Bed
--
Bath
1,661
Sq Ft
$288/Sq Ft
Est. Value
About This Home
This home is located at 223 Gordon St, Perth Amboy, NJ 08861 and is currently estimated at $478,888, approximately $288 per square foot. 223 Gordon St is a home located in Middlesex County with nearby schools including Perth Amboy High School, Middlesex County STEM Charter School, and Academy for Urban Leadership Charter School.
Ownership History
Date
Name
Owned For
Owner Type
Purchase Details
Closed on
Jul 29, 2020
Sold by
Manana Rafael
Bought by
Morales Jeffrey
Current Estimated Value
Purchase Details
Closed on
Mar 16, 2017
Sold by
Cepeda Luz and Manana Rafael
Bought by
Manana Rafael
Purchase Details
Closed on
Oct 6, 2005
Sold by
Freeman Robert
Bought by
Manana Rafael
Home Financials for this Owner
Home Financials are based on the most recent Mortgage that was taken out on this home.
Original Mortgage
$158,332
Interest Rate
5.79%
Create a Home Valuation Report for This Property
The Home Valuation Report is an in-depth analysis detailing your home's value as well as a comparison with similar homes in the area
Home Values in the Area
Average Home Value in this Area
Purchase History
| Date | Buyer | Sale Price | Title Company |
|---|---|---|---|
| Morales Jeffrey | -- | None Available | |
| Manana Rafael | -- | None Available | |
| Manana Rafael | $155,000 | -- |
Source: Public Records
Mortgage History
| Date | Status | Borrower | Loan Amount |
|---|---|---|---|
| Previous Owner | Manana Rafael | $158,332 |
Source: Public Records
Tax History Compared to Growth
Tax History
| Year | Tax Paid | Tax Assessment Tax Assessment Total Assessment is a certain percentage of the fair market value that is determined by local assessors to be the total taxable value of land and additions on the property. | Land | Improvement |
|---|---|---|---|---|
| 2025 | $7,180 | $238,000 | $89,600 | $148,400 |
| 2024 | $7,166 | $238,000 | $89,600 | $148,400 |
| 2023 | $7,166 | $238,000 | $89,600 | $148,400 |
| 2022 | $7,081 | $238,000 | $89,600 | $148,400 |
| 2021 | $7,090 | $238,000 | $89,600 | $148,400 |
| 2020 | $7,088 | $238,000 | $89,600 | $148,400 |
| 2019 | $6,946 | $232,400 | $89,600 | $142,800 |
| 2018 | $6,886 | $232,400 | $89,600 | $142,800 |
| 2017 | $6,872 | $232,400 | $89,600 | $142,800 |
| 2016 | $6,693 | $232,400 | $89,600 | $142,800 |
| 2015 | $6,740 | $232,400 | $89,600 | $142,800 |
| 2014 | $6,781 | $232,400 | $89,600 | $142,800 |
Source: Public Records
Map
Nearby Homes
- 187 Gordon St
- 136 1st St
- 278 Market St
- 267 Elm St
- 87-89 1st St
- 102 Madison Ave
- 112 Catalpa Ave
- 371 Market St
- 374 Oak St
- 399 Park Ave
- 55 Smith St
- 318 High St
- 402 Hidden Village Dr
- 309 Hidden Village Dr
- 307 Hidden Village Dr
- 331 Rector St Unit B
- 283 Water St
- 0-50-52 Broad St
- 395 Mechanic St
- 371 Mcguire Place