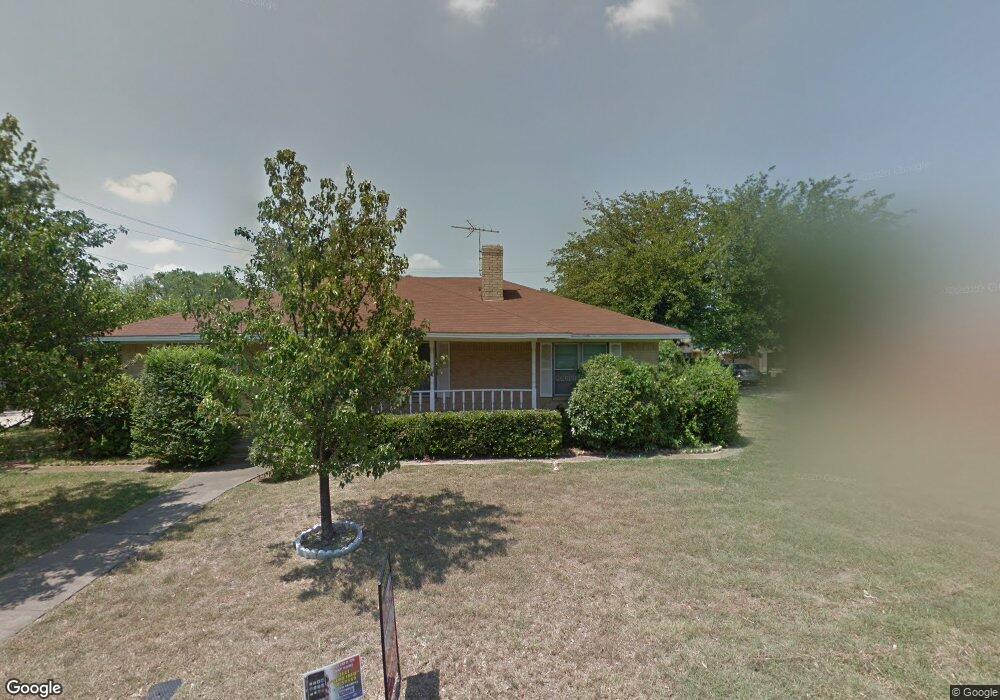
223 Hillcrest St Sanger, TX 76266
Estimated Value: $262,000 - $290,000
3
Beds
2
Baths
1,708
Sq Ft
$163/Sq Ft
Est. Value
About This Home
This home is located at 223 Hillcrest St, Sanger, TX 76266 and is currently estimated at $277,578, approximately $162 per square foot. 223 Hillcrest St is a home located in Denton County with nearby schools including Chisholm Trail Elementary School, Clear Creek Intermediate School, and Sanger Sixth Grade Campus.
Ownership History
Date
Name
Owned For
Owner Type
Purchase Details
Closed on
Nov 14, 2013
Sold by
Hartsburg Virginia A
Bought by
Breon Holly A
Current Estimated Value
Home Financials for this Owner
Home Financials are based on the most recent Mortgage that was taken out on this home.
Original Mortgage
$108,498
Outstanding Balance
$80,977
Interest Rate
4.25%
Mortgage Type
FHA
Estimated Equity
$196,602
Purchase Details
Closed on
Oct 1, 2003
Sold by
Smith Phillip Calvin and Smith Debra Diane
Bought by
Hartsburg Stephen R and Hartsburg Virginia A
Home Financials for this Owner
Home Financials are based on the most recent Mortgage that was taken out on this home.
Original Mortgage
$95,148
Interest Rate
6.25%
Mortgage Type
FHA
Purchase Details
Closed on
Dec 17, 1999
Sold by
Gaines Marilyn M
Bought by
Smith Phillip Calvin and Smith Debra Diane
Home Financials for this Owner
Home Financials are based on the most recent Mortgage that was taken out on this home.
Original Mortgage
$84,350
Interest Rate
7.71%
Create a Home Valuation Report for This Property
The Home Valuation Report is an in-depth analysis detailing your home's value as well as a comparison with similar homes in the area
Home Values in the Area
Average Home Value in this Area
Purchase History
| Date | Buyer | Sale Price | Title Company |
|---|---|---|---|
| Breon Holly A | -- | Fatco | |
| Hartsburg Stephen R | -- | -- | |
| Smith Phillip Calvin | -- | -- |
Source: Public Records
Mortgage History
| Date | Status | Borrower | Loan Amount |
|---|---|---|---|
| Open | Breon Holly A | $108,498 | |
| Previous Owner | Hartsburg Stephen R | $95,148 | |
| Previous Owner | Smith Phillip Calvin | $84,350 |
Source: Public Records
Tax History Compared to Growth
Tax History
| Year | Tax Paid | Tax Assessment Tax Assessment Total Assessment is a certain percentage of the fair market value that is determined by local assessors to be the total taxable value of land and additions on the property. | Land | Improvement |
|---|---|---|---|---|
| 2025 | $3,405 | $211,658 | $66,071 | $145,587 |
| 2024 | $4,558 | $225,526 | $0 | $0 |
| 2023 | $2,998 | $205,024 | $66,071 | $200,752 |
| 2022 | $4,133 | $186,385 | $45,694 | $164,750 |
| 2021 | $3,561 | $169,441 | $45,694 | $123,747 |
| 2020 | $3,555 | $160,679 | $32,443 | $128,236 |
| 2019 | $3,593 | $157,831 | $32,443 | $130,501 |
| 2018 | $3,284 | $143,483 | $32,443 | $111,040 |
| 2017 | $3,100 | $134,776 | $31,072 | $106,324 |
| 2016 | $2,818 | $122,524 | $29,701 | $98,142 |
| 2015 | $2,375 | $111,385 | $29,701 | $81,684 |
| 2013 | -- | $109,628 | $29,701 | $79,927 |
Source: Public Records
Map
Nearby Homes
- 226 Hillcrest St
- 212 Diane Dr
- 202 Southland Dr
- 113 Diane Dr
- 209 Southland Dr
- 109 Colonial Heights
- 124 Morning Glory
- 130 Southside Dr
- 505 Houston St
- 321 Quail Crossing Dr
- 319 Quail Crossing Dr
- 2000 S Stemmons St
- 319 Austin St
- 108 Magnolia Dr
- 2004 S Stemmons St
- 185 Aster Dr
- 114 Pintail Ln
- 509 Marshall St
- 936 First St
- 942 First St