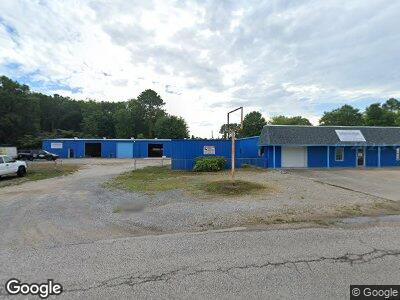
223 Industrial Pkwy Lafayette, LA 70508
Pilette NeighborhoodEstimated Value: $225,787
--
Bed
2
Baths
15,337
Sq Ft
$15/Sq Ft
Est. Value
About This Home
This home is located at 223 Industrial Pkwy, Lafayette, LA 70508 and is currently estimated at $225,787, approximately $14 per square foot. 223 Industrial Pkwy is a home located in Lafayette Parish with nearby schools including Corporal Michael Middlebrook Elementary School, L.J. Alleman Middle School, and O. Comeaux High School.
Ownership History
Date
Name
Owned For
Owner Type
Purchase Details
Closed on
Dec 12, 2024
Sold by
Garage Solutions Llc
Bought by
M & L Fontenot Properties Llc
Current Estimated Value
Home Financials for this Owner
Home Financials are based on the most recent Mortgage that was taken out on this home.
Original Mortgage
$537,500
Outstanding Balance
$537,500
Interest Rate
6.72%
Mortgage Type
New Conventional
Estimated Equity
-$311,439
Purchase Details
Closed on
Jun 13, 2023
Sold by
Lafayette Consolidated Government
Bought by
321 Properties Llc
Purchase Details
Closed on
Dec 29, 2021
Sold by
Guidrys Hardware & Supply Inc
Bought by
Garage Solutions Llc
Home Financials for this Owner
Home Financials are based on the most recent Mortgage that was taken out on this home.
Original Mortgage
$100,000
Interest Rate
3.11%
Mortgage Type
New Conventional
Create a Home Valuation Report for This Property
The Home Valuation Report is an in-depth analysis detailing your home's value as well as a comparison with similar homes in the area
Home Values in the Area
Average Home Value in this Area
Purchase History
| Date | Buyer | Sale Price | Title Company |
|---|---|---|---|
| M & L Fontenot Properties Llc | -- | None Listed On Document | |
| 321 Properties Llc | -- | None Listed On Document | |
| Garage Solutions Llc | $213,000 | None Listed On Document |
Source: Public Records
Mortgage History
| Date | Status | Borrower | Loan Amount |
|---|---|---|---|
| Open | M & L Fontenot Properties Llc | $537,500 | |
| Previous Owner | Garage Solutions Llc | $209,732 | |
| Previous Owner | Garage Solutions Llc | $100,000 |
Source: Public Records
Tax History Compared to Growth
Tax History
| Year | Tax Paid | Tax Assessment Tax Assessment Total Assessment is a certain percentage of the fair market value that is determined by local assessors to be the total taxable value of land and additions on the property. | Land | Improvement |
|---|---|---|---|---|
| 2024 | $3,401 | $32,328 | $4,560 | $27,768 |
| 2023 | $3,401 | $27,842 | $4,560 | $23,282 |
| 2022 | $2,697 | $25,779 | $4,560 | $21,219 |
| 2021 | $2,372 | $22,596 | $4,560 | $18,036 |
| 2020 | $2,364 | $22,596 | $4,560 | $18,036 |
| 2019 | $2,587 | $25,779 | $4,560 | $21,219 |
| 2018 | $2,631 | $25,779 | $4,560 | $21,219 |
| 2017 | $2,628 | $25,779 | $4,560 | $21,219 |
| 2015 | $2,462 | $24,189 | $2,970 | $21,219 |
| 2013 | -- | $24,189 | $2,970 | $21,219 |
Source: Public Records
Map
Nearby Homes
- 319 Rue de Commerce St
- 305 E S College Extension
- 211 Sage Glenn Ln
- 0 Rue Beauregard Unit Lot 154 24002756
- 112 Hardwood Dr
- Tbd Hugh Wallis Rd S
- 2301 W Pinhook Rd
- 1208 Hugh Wallis Rd S
- 313 Rosemary Place
- 3701 W Pinhook Rd
- 3734 W Pinhook Rd
- 1926 W Pinhook Rd
- 211 E Kaliste Saloom Rd Unit Lot 152
- 531 Esplanade St
- 2000 S College Rd
- 200 Blk Feu Follet Rd
- 147 Teche Dr
- 107 Kingspointe Cir
- 428 Feu Follet Rd
- 116 Keller St
- 223 Industrial Pkwy
- 231 Industrial Pkwy
- 288 Mecca St
- 228 Industrial Pkwy
- 289 Mecca St
- 208 Industrial Pkwy
- 291 Mecca St
- 206 Industrial Pkwy
- 246 Industrial Pkwy
- 2200 S College Rd
- 299 Mecca St
- 2100 Blk S College Rd
- 2114 S College Rd
- 2266 S College Rd Unit C
- 107 Angel St
- 113 Eunice St
- 113 Eunice St
- 300 Mecca St
- 105 Angel St
- 300 Wilcox St