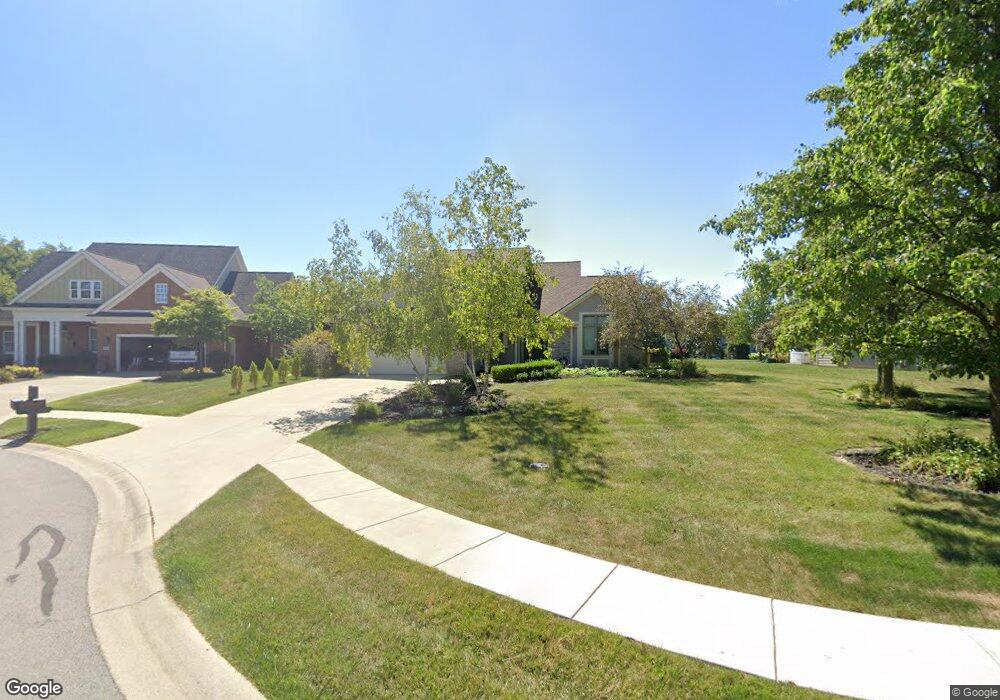
223 Locust Ct Bluffton, OH 45817
Estimated Value: $340,857 - $394,000
3
Beds
3
Baths
1,911
Sq Ft
$197/Sq Ft
Est. Value
About This Home
This home is located at 223 Locust Ct, Bluffton, OH 45817 and is currently estimated at $376,714, approximately $197 per square foot. 223 Locust Ct is a home located in Allen County with nearby schools including Bluffton Elementary School, Bluffton Middle School, and Bluffton High School.
Ownership History
Date
Name
Owned For
Owner Type
Purchase Details
Closed on
Aug 2, 2005
Sold by
Kelley Carole J
Bought by
Lee Young Ah
Current Estimated Value
Home Financials for this Owner
Home Financials are based on the most recent Mortgage that was taken out on this home.
Original Mortgage
$206,100
Outstanding Balance
$108,615
Interest Rate
5.71%
Mortgage Type
New Conventional
Estimated Equity
$268,099
Purchase Details
Closed on
Apr 2, 2001
Sold by
Clemens Dev Systems Inc
Bought by
Kelley Carole J
Home Financials for this Owner
Home Financials are based on the most recent Mortgage that was taken out on this home.
Original Mortgage
$35,000
Interest Rate
7.02%
Mortgage Type
New Conventional
Create a Home Valuation Report for This Property
The Home Valuation Report is an in-depth analysis detailing your home's value as well as a comparison with similar homes in the area
Home Values in the Area
Average Home Value in this Area
Purchase History
| Date | Buyer | Sale Price | Title Company |
|---|---|---|---|
| Lee Young Ah | $229,000 | None Available | |
| Kelley Carole J | $177,500 | -- |
Source: Public Records
Mortgage History
| Date | Status | Borrower | Loan Amount |
|---|---|---|---|
| Open | Lee Young Ah | $206,100 | |
| Previous Owner | Kelley Carole J | $35,000 |
Source: Public Records
Tax History
| Year | Tax Paid | Tax Assessment Tax Assessment Total Assessment is a certain percentage of the fair market value that is determined by local assessors to be the total taxable value of land and additions on the property. | Land | Improvement |
|---|---|---|---|---|
| 2024 | $3,227 | $97,270 | $13,620 | $83,650 |
| 2023 | $3,327 | $92,610 | $12,950 | $79,660 |
| 2022 | $3,343 | $92,610 | $12,950 | $79,660 |
| 2021 | $3,367 | $92,610 | $12,950 | $79,660 |
| 2020 | $3,106 | $77,360 | $12,290 | $65,070 |
| 2019 | $3,106 | $77,360 | $12,290 | $65,070 |
| 2018 | $3,122 | $77,360 | $12,290 | $65,070 |
| 2017 | $2,677 | $66,510 | $12,290 | $54,220 |
| 2016 | $2,684 | $66,510 | $12,290 | $54,220 |
| 2015 | $2,728 | $66,510 | $12,290 | $54,220 |
| 2014 | $2,927 | $70,290 | $12,990 | $57,300 |
| 2013 | $2,716 | $70,290 | $12,990 | $57,300 |
Source: Public Records
Map
Nearby Homes
- 160 Chestnut Ln
- 110 Magnolia Ln
- 0 Columbus Grove-Bluffton Rd
- 217 Grove St
- 218 S Jackson St
- 513 S Jackson St
- 307 Parkview Dr
- 305 Parkview Dr
- 303 Parkview Dr
- 315 Parkview Dr
- 222 N Lawn Ave
- 301 Parkview Dr
- 317 Parkview Dr
- 319 Parkview Dr
- 321 Parkview Dr
- 307 S Main St Unit back
- 327 Parkview Dr
- 329 Parkview Dr
- 210 N Jackson St
- 331 Parkview Dr
- 222 Locust Ct
- 224 Locust Ct
- 105 Hawthorn Ct
- 104 Hawthorn Ct
- 225 Locust Ct
- 221 Locust Ct
- 228 Locust Ct
- 229 Locust Ct
- 206 Riverbend Dr
- 227 Locust Ct
- 103 Hawthorn Ct
- 230 Locust Ct
- 226 Locust Ct
- 200 Riverbend Dr
- 212 Riverbend Dr
- 231 Locust Ct
- 220 Riverbend Dr
- 102 Hawthorn Ct
- 101 Hawthorn Ct
- 345 Sycamore Ct
Your Personal Tour Guide
Ask me questions while you tour the home.