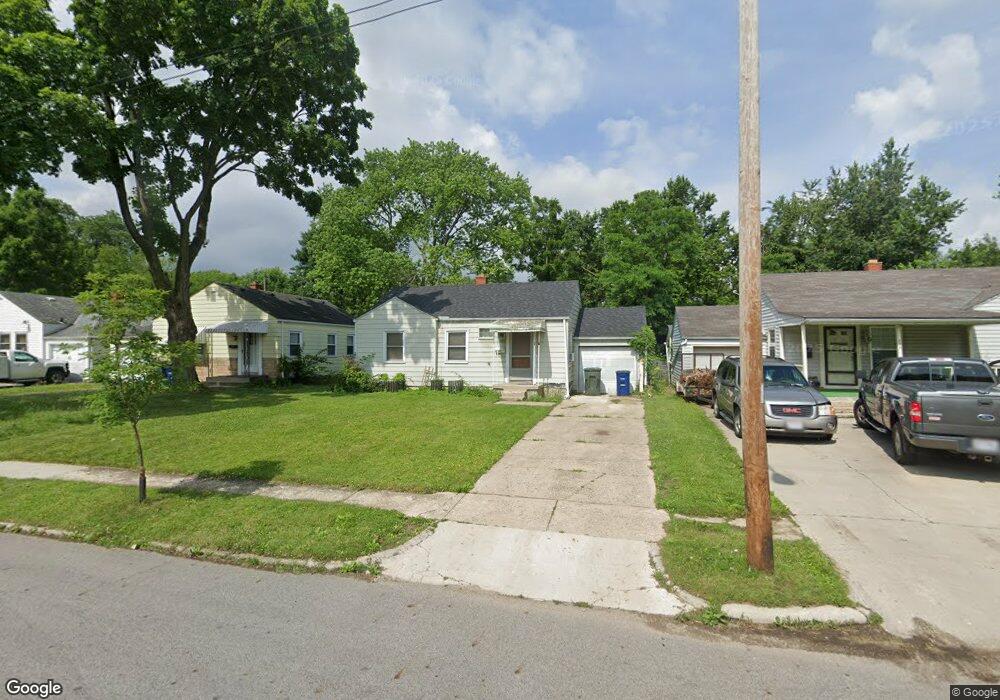
223 Lowell Rd Columbus, OH 43209
Broadleigh NeighborhoodEstimated Value: $152,730 - $181,000
2
Beds
1
Bath
756
Sq Ft
$225/Sq Ft
Est. Value
About This Home
This home is located at 223 Lowell Rd, Columbus, OH 43209 and is currently estimated at $170,433, approximately $225 per square foot. 223 Lowell Rd is a home located in Franklin County with nearby schools including Broadleigh Elementary School, Johnson Park Middle School, and Walnut Ridge High School.
Ownership History
Date
Name
Owned For
Owner Type
Purchase Details
Closed on
Apr 24, 2003
Sold by
Birkhold Erik Hamilton
Bought by
Birkhold Erik Hamilton and Birkhold Audrey
Current Estimated Value
Home Financials for this Owner
Home Financials are based on the most recent Mortgage that was taken out on this home.
Original Mortgage
$85,500
Outstanding Balance
$36,050
Interest Rate
5.86%
Estimated Equity
$134,383
Purchase Details
Closed on
Oct 10, 1996
Sold by
Birkhold Dorotha J
Bought by
Erik Hamilton Birkhold
Home Financials for this Owner
Home Financials are based on the most recent Mortgage that was taken out on this home.
Original Mortgage
$39,600
Interest Rate
9.38%
Mortgage Type
New Conventional
Purchase Details
Closed on
May 16, 1995
Sold by
Lee Minnie E
Bought by
Clipner Minnie E Lee and Clipner Deborah K
Create a Home Valuation Report for This Property
The Home Valuation Report is an in-depth analysis detailing your home's value as well as a comparison with similar homes in the area
Home Values in the Area
Average Home Value in this Area
Purchase History
| Date | Buyer | Sale Price | Title Company |
|---|---|---|---|
| Birkhold Erik Hamilton | -- | Landsel Title Agency Inc | |
| Erik Hamilton Birkhold | $44,000 | -- | |
| Clipner Minnie E Lee | $20,000 | -- |
Source: Public Records
Mortgage History
| Date | Status | Borrower | Loan Amount |
|---|---|---|---|
| Open | Birkhold Erik Hamilton | $85,500 | |
| Closed | Erik Hamilton Birkhold | $39,600 |
Source: Public Records
Tax History
| Year | Tax Paid | Tax Assessment Tax Assessment Total Assessment is a certain percentage of the fair market value that is determined by local assessors to be the total taxable value of land and additions on the property. | Land | Improvement |
|---|---|---|---|---|
| 2025 | $2,430 | $54,150 | $16,940 | $37,210 |
| 2024 | $2,430 | $54,150 | $16,940 | $37,210 |
| 2023 | $2,399 | $54,145 | $16,940 | $37,205 |
| 2022 | $1,142 | $22,020 | $6,340 | $15,680 |
| 2021 | $1,144 | $22,020 | $6,340 | $15,680 |
| 2020 | $1,146 | $22,020 | $6,340 | $15,680 |
| 2019 | $1,117 | $18,420 | $5,290 | $13,130 |
| 2018 | $1,041 | $18,420 | $5,290 | $13,130 |
| 2017 | $1,091 | $18,420 | $5,290 | $13,130 |
| 2016 | $1,065 | $16,070 | $3,920 | $12,150 |
| 2015 | $966 | $16,070 | $3,920 | $12,150 |
| 2014 | $969 | $16,070 | $3,920 | $12,150 |
| 2013 | $503 | $16,905 | $4,130 | $12,775 |
Source: Public Records
Map
Nearby Homes
- 238 Edgevale Rd
- 194 N Kellner Rd
- 256 N Kellner Rd
- 157 N Kellner Rd
- 243 N James Rd
- 253 N James Rd
- 177 N James Rd
- 180 N Harding Rd
- 73 N Everett Ave
- 73 N Hampton Rd
- 3191 E Broad St
- 205 N Gould Rd
- 50 N Hampton Rd
- 161 N Gould Rd
- 50 S Chesterfield Rd
- 3288 E 5th Ave
- 41 S Broadleigh Rd
- 3116 E 5th Ave
- 181 S Kellner Rd
- 68 S Weyant Ave
Your Personal Tour Guide
Ask me questions while you tour the home.