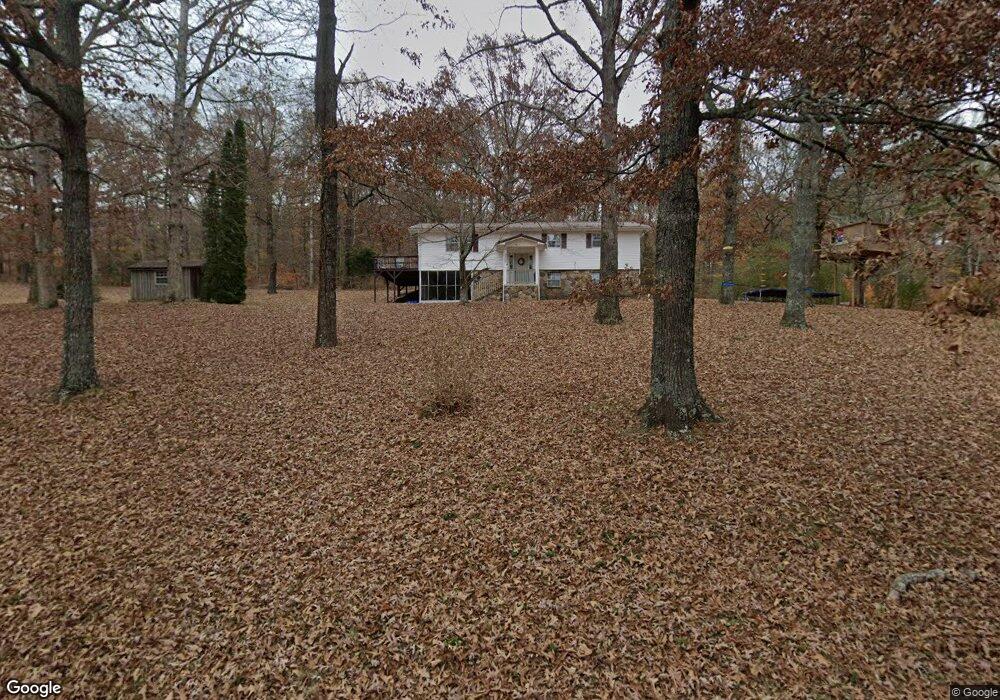
223 May Rd Dunlap, TN 37327
Estimated Value: $210,000 - $288,000
3
Beds
2
Baths
1,846
Sq Ft
$133/Sq Ft
Est. Value
About This Home
This home is located at 223 May Rd, Dunlap, TN 37327 and is currently estimated at $246,367, approximately $133 per square foot. 223 May Rd is a home located in Sequatchie County with nearby schools including Griffith Elementary School, Sequatchie County Middle School, and Sequatchie County High School.
Ownership History
Date
Name
Owned For
Owner Type
Purchase Details
Closed on
Jul 27, 2020
Sold by
Swaffford Kelly Michelle and Somerville Kelly M
Bought by
Broome Courtney
Current Estimated Value
Home Financials for this Owner
Home Financials are based on the most recent Mortgage that was taken out on this home.
Original Mortgage
$98,188
Outstanding Balance
$86,844
Interest Rate
3.2%
Mortgage Type
FHA
Estimated Equity
$159,523
Purchase Details
Closed on
Apr 28, 2010
Sold by
Gehrich Ernest J
Bought by
Swafford Kelly Michelle
Home Financials for this Owner
Home Financials are based on the most recent Mortgage that was taken out on this home.
Original Mortgage
$89,910
Interest Rate
5.06%
Purchase Details
Closed on
May 3, 2006
Sold by
Et Seals Jackie C Deceased
Bought by
Gehrich Ernest J
Purchase Details
Closed on
Aug 30, 1996
Sold by
Seals Jackie C and Seals Wife
Bought by
Shannon Seals
Purchase Details
Closed on
Mar 19, 1992
Purchase Details
Closed on
May 10, 1991
Bought by
Seals Jaclie C and Wife Doris L
Create a Home Valuation Report for This Property
The Home Valuation Report is an in-depth analysis detailing your home's value as well as a comparison with similar homes in the area
Home Values in the Area
Average Home Value in this Area
Purchase History
| Date | Buyer | Sale Price | Title Company |
|---|---|---|---|
| Broome Courtney | $100,000 | None Available | |
| Swafford Kelly Michelle | $99,900 | -- | |
| Gehrich Ernest J | $100,000 | -- | |
| Shannon Seals | $26,050 | -- | |
| -- | -- | -- | |
| Seals Jaclie C | $47,500 | -- |
Source: Public Records
Mortgage History
| Date | Status | Borrower | Loan Amount |
|---|---|---|---|
| Open | Broome Courtney | $98,188 | |
| Previous Owner | Seals Jaclie C | $89,910 |
Source: Public Records
Tax History
| Year | Tax Paid | Tax Assessment Tax Assessment Total Assessment is a certain percentage of the fair market value that is determined by local assessors to be the total taxable value of land and additions on the property. | Land | Improvement |
|---|---|---|---|---|
| 2025 | $1,106 | $45,775 | $5,600 | $40,175 |
| 2024 | $1,106 | $45,775 | $5,600 | $40,175 |
| 2023 | $1,106 | $45,775 | $5,600 | $40,175 |
| 2022 | $776 | $23,400 | $3,550 | $19,850 |
| 2021 | $764 | $23,400 | $3,550 | $19,850 |
| 2020 | $764 | $23,400 | $3,550 | $19,850 |
| 2019 | $764 | $23,400 | $3,550 | $19,850 |
| 2018 | $756 | $23,400 | $3,550 | $19,850 |
| 2017 | $747 | $23,400 | $3,550 | $19,850 |
| 2016 | $765 | $22,975 | $3,800 | $19,175 |
| 2015 | $765 | $22,975 | $3,800 | $19,175 |
| 2014 | $746 | $22,400 | $3,800 | $18,600 |
Source: Public Records
Map
Nearby Homes
- 153 Nix Rd
- 88 Clover Dale Rd S
- 13875 Rankin Ave
- 83 Robin Hill Rd
- 83 Robin Hill Rd B Rd
- 83 83 Robin Hill Rd B
- 35 Hummingbird Ln
- 919 John Burch Rd
- 108 Galloway Airport Rd
- 173 Hidden Meadow Ln
- 0 Countryside Dr Unit RTC3035699
- 0 Countryside Dr Unit 1310228
- 132 Galloway Airport Rd
- 00 Countryside Dr
- 16 Countryside Dr
- 0 Shady Oaks Cove Unit 1525918
- 67 Shady Oaks Cove
- 387 Dogwood Ln
- 0 Treeline Dr Unit 1510685
- 0 Treeline Dr Unit RTC2815537
- 341 May Rd
- 0 May Rd
- 183 May Rd
- 282 May Rd
- 371 May St
- 371 May Rd
- 61721/2 Sr 28
- 6188 Tennessee 28
- 6188 State Route 28
- 301 Nix Rd
- 6172 Tennessee 28
- 6172 State Route 28
- 6158 State Route 28
- 34.1 May Rd
- 1 May Rd
- 560 Rabbit Farm Rd
- 252 Clover Dale Rd N
- 6153 State Route 28
- 198 Clover Dale Rd N
- 218 Clover Dale Rd N
Your Personal Tour Guide
Ask me questions while you tour the home.