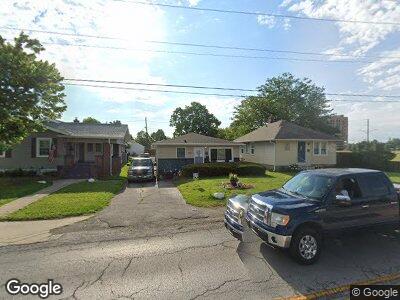
223 N 17th Ave Beech Grove, IN 46107
Estimated Value: $167,000 - $190,000
3
Beds
2
Baths
988
Sq Ft
$183/Sq Ft
Est. Value
About This Home
This home is located at 223 N 17th Ave, Beech Grove, IN 46107 and is currently estimated at $180,655, approximately $182 per square foot. 223 N 17th Ave is a home located in Marion County with nearby schools including Hornet Park Elementary School, Central Elementary School, and South Grove Intermediate School.
Ownership History
Date
Name
Owned For
Owner Type
Purchase Details
Closed on
Sep 20, 2019
Sold by
Jones Kathryn A and Burford Kathryn A Jones
Bought by
Sichting Brittany
Current Estimated Value
Home Financials for this Owner
Home Financials are based on the most recent Mortgage that was taken out on this home.
Original Mortgage
$105,000
Outstanding Balance
$93,168
Interest Rate
3.6%
Mortgage Type
New Conventional
Estimated Equity
$98,433
Create a Home Valuation Report for This Property
The Home Valuation Report is an in-depth analysis detailing your home's value as well as a comparison with similar homes in the area
Home Values in the Area
Average Home Value in this Area
Purchase History
| Date | Buyer | Sale Price | Title Company |
|---|---|---|---|
| Sichting Brittany | $105,000 | Atlantis Title Services |
Source: Public Records
Mortgage History
| Date | Status | Borrower | Loan Amount |
|---|---|---|---|
| Open | Sichting Brittany | $105,000 | |
| Previous Owner | Jones Kathryn A | $104,996 |
Source: Public Records
Tax History Compared to Growth
Tax History
| Year | Tax Paid | Tax Assessment Tax Assessment Total Assessment is a certain percentage of the fair market value that is determined by local assessors to be the total taxable value of land and additions on the property. | Land | Improvement |
|---|---|---|---|---|
| 2024 | $1,789 | $119,100 | $18,000 | $101,100 |
| 2023 | $1,789 | $116,600 | $18,000 | $98,600 |
| 2022 | $1,664 | $105,100 | $18,000 | $87,100 |
| 2021 | $1,323 | $91,100 | $18,000 | $73,100 |
| 2020 | $1,065 | $83,500 | $18,000 | $65,500 |
| 2019 | $958 | $76,200 | $14,800 | $61,400 |
| 2018 | $945 | $71,300 | $14,800 | $56,500 |
| 2017 | $908 | $69,500 | $14,800 | $54,700 |
| 2016 | $893 | $67,300 | $14,800 | $52,500 |
| 2014 | $784 | $64,200 | $14,800 | $49,400 |
| 2013 | $878 | $64,200 | $14,800 | $49,400 |
Source: Public Records
Map
Nearby Homes