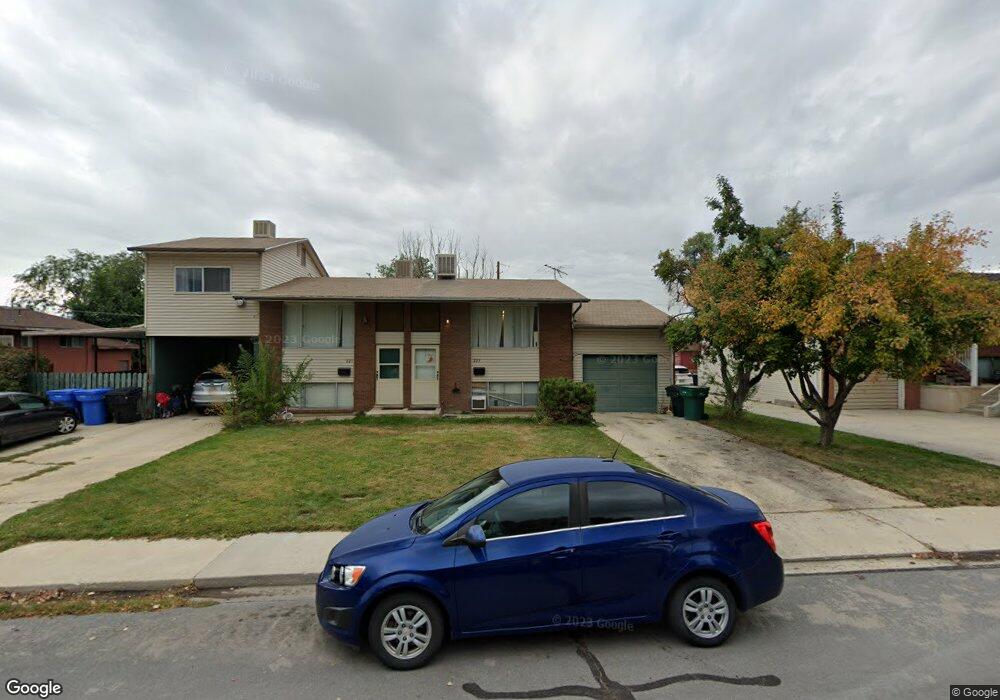
223 N 300 E Orem, UT 84057
Sharon NeighborhoodEstimated Value: $619,000 - $678,046
5
Beds
2
Baths
2,392
Sq Ft
$270/Sq Ft
Est. Value
About This Home
This home is located at 223 N 300 E, Orem, UT 84057 and is currently estimated at $647,015, approximately $270 per square foot. 223 N 300 E is a home located in Utah County with nearby schools including Cascade Elementary School, Canyon View Junior High School, and Orem High School.
Ownership History
Date
Name
Owned For
Owner Type
Purchase Details
Closed on
Jan 7, 2011
Sold by
Jackson Robert B
Bought by
Jackson Robert B
Current Estimated Value
Home Financials for this Owner
Home Financials are based on the most recent Mortgage that was taken out on this home.
Original Mortgage
$182,773
Outstanding Balance
$122,575
Interest Rate
4.75%
Mortgage Type
FHA
Estimated Equity
$524,440
Purchase Details
Closed on
Sep 10, 2004
Sold by
Johnson L Arden and Johnson Clara B
Bought by
Johnson L Arden and Johnson Clara B
Purchase Details
Closed on
Apr 19, 2004
Sold by
Meldrum Raymond S and Meldrum Andrea
Bought by
Jackson Robert B
Create a Home Valuation Report for This Property
The Home Valuation Report is an in-depth analysis detailing your home's value as well as a comparison with similar homes in the area
Home Values in the Area
Average Home Value in this Area
Purchase History
| Date | Buyer | Sale Price | Title Company |
|---|---|---|---|
| Jackson Robert B | -- | Access Title Company | |
| Johnson L Arden | -- | -- | |
| Jackson Robert B | -- | Title West Title Company |
Source: Public Records
Mortgage History
| Date | Status | Borrower | Loan Amount |
|---|---|---|---|
| Open | Jackson Robert B | $182,773 |
Source: Public Records
Tax History
| Year | Tax Paid | Tax Assessment Tax Assessment Total Assessment is a certain percentage of the fair market value that is determined by local assessors to be the total taxable value of land and additions on the property. | Land | Improvement |
|---|---|---|---|---|
| 2025 | $2,293 | $284,790 | -- | -- |
| 2024 | $2,293 | $280,335 | $0 | $0 |
| 2023 | $2,112 | $277,585 | $0 | $0 |
| 2022 | $2,020 | $257,235 | $0 | $0 |
| 2021 | $1,866 | $359,800 | $103,000 | $256,800 |
| 2020 | $1,766 | $334,800 | $95,900 | $238,900 |
| 2019 | $1,580 | $311,400 | $89,200 | $222,200 |
| 2018 | $1,438 | $270,800 | $125,400 | $145,400 |
| 2017 | $1,479 | $149,160 | $0 | $0 |
| 2016 | $1,603 | $149,160 | $0 | $0 |
| 2015 | $1,555 | $136,840 | $0 | $0 |
| 2014 | $1,373 | $120,230 | $0 | $0 |
Source: Public Records
Map
Nearby Homes
Your Personal Tour Guide
Ask me questions while you tour the home.