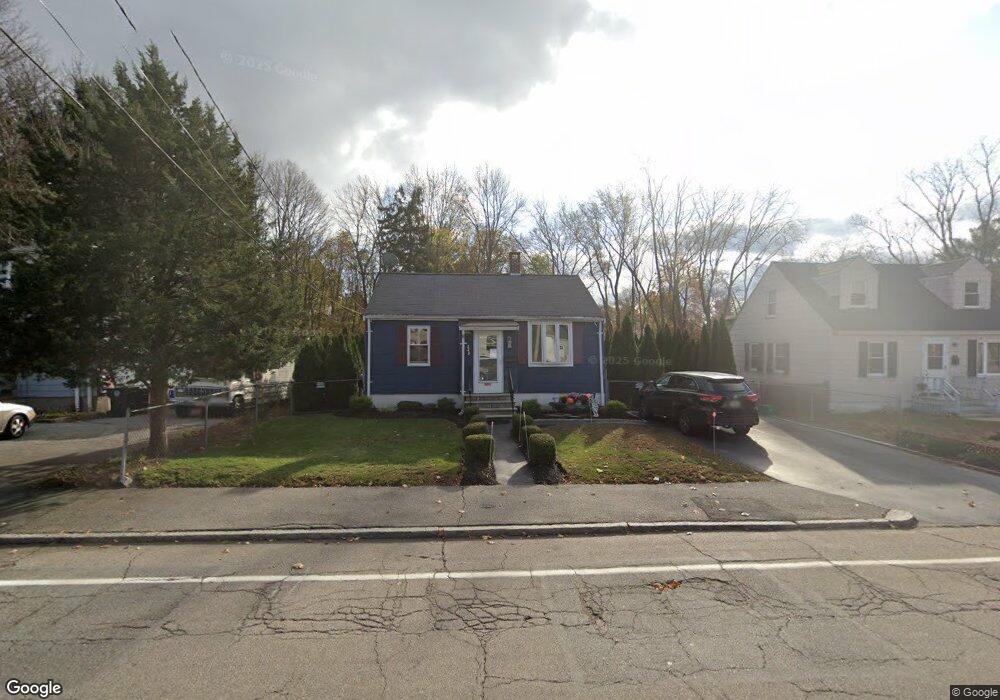
223 Perkins Ave Brockton, MA 02302
Campello NeighborhoodEstimated Value: $390,000 - $451,000
2
Beds
1
Bath
776
Sq Ft
$539/Sq Ft
Est. Value
About This Home
This home is located at 223 Perkins Ave, Brockton, MA 02302 and is currently estimated at $417,929, approximately $538 per square foot. 223 Perkins Ave is a home located in Plymouth County with nearby schools including Davis K-8 School, John F. Kennedy Elementary School, and South Middle School.
Ownership History
Date
Name
Owned For
Owner Type
Purchase Details
Closed on
Jul 20, 2015
Sold by
Iacovo Peter
Bought by
Iacovo Peter
Current Estimated Value
Purchase Details
Closed on
Dec 7, 2007
Sold by
Rybka Robert
Bought by
Iacovo Peter
Purchase Details
Closed on
Mar 15, 2002
Sold by
Mirabile James A and Mirabile Brenda L
Bought by
Iacovo Peter and Rybka Robert H
Purchase Details
Closed on
Jan 17, 1995
Sold by
Callahan Thomas M and Callahan Eileen M
Bought by
Mirabile James A and Deane Brenda L
Create a Home Valuation Report for This Property
The Home Valuation Report is an in-depth analysis detailing your home's value as well as a comparison with similar homes in the area
Home Values in the Area
Average Home Value in this Area
Purchase History
| Date | Buyer | Sale Price | Title Company |
|---|---|---|---|
| Iacovo Peter | -- | -- | |
| Iacovo Peter | -- | -- | |
| Iacovo Peter | $132,500 | -- | |
| Mirabile James A | $53,500 | -- |
Source: Public Records
Mortgage History
| Date | Status | Borrower | Loan Amount |
|---|---|---|---|
| Previous Owner | Mirabile James A | $168,800 | |
| Previous Owner | Mirabile James A | $179,000 |
Source: Public Records
Tax History Compared to Growth
Tax History
| Year | Tax Paid | Tax Assessment Tax Assessment Total Assessment is a certain percentage of the fair market value that is determined by local assessors to be the total taxable value of land and additions on the property. | Land | Improvement |
|---|---|---|---|---|
| 2025 | $4,295 | $354,700 | $136,800 | $217,900 |
| 2024 | $4,023 | $334,700 | $136,800 | $197,900 |
| 2023 | $3,912 | $301,400 | $102,200 | $199,200 |
| 2022 | $3,414 | $244,400 | $92,800 | $151,600 |
| 2021 | $3,542 | $244,300 | $76,700 | $167,600 |
| 2020 | $3,468 | $228,900 | $72,300 | $156,600 |
| 2019 | $3,395 | $218,500 | $70,000 | $148,500 |
| 2018 | $2,732 | $170,100 | $70,000 | $100,100 |
| 2017 | $2,618 | $162,600 | $70,000 | $92,600 |
| 2016 | $2,285 | $131,600 | $67,800 | $63,800 |
| 2015 | $2,095 | $115,400 | $67,800 | $47,600 |
| 2014 | $2,116 | $116,700 | $67,800 | $48,900 |
Source: Public Records
Map
Nearby Homes
- 112 Hillside Ave
- 44 Baker St
- 163 S Leyden St
- 34 Carl Ave
- 54 Ferris Ave
- 28 Wallace St
- 223 Clinton St Unit 10
- 223 Clinton St Unit 3
- 12 Paulin Ave
- 70 Carlisle St
- 103 Clinton St
- 265 Summer St
- 229 Sinclair Rd
- 221 Sinclair Rd
- 16 Yuba Cir
- 65 Tremont St
- 122 Sinclair Rd
- 24 Ithica Rd
- 99 Grove St
- 936 Warren Ave