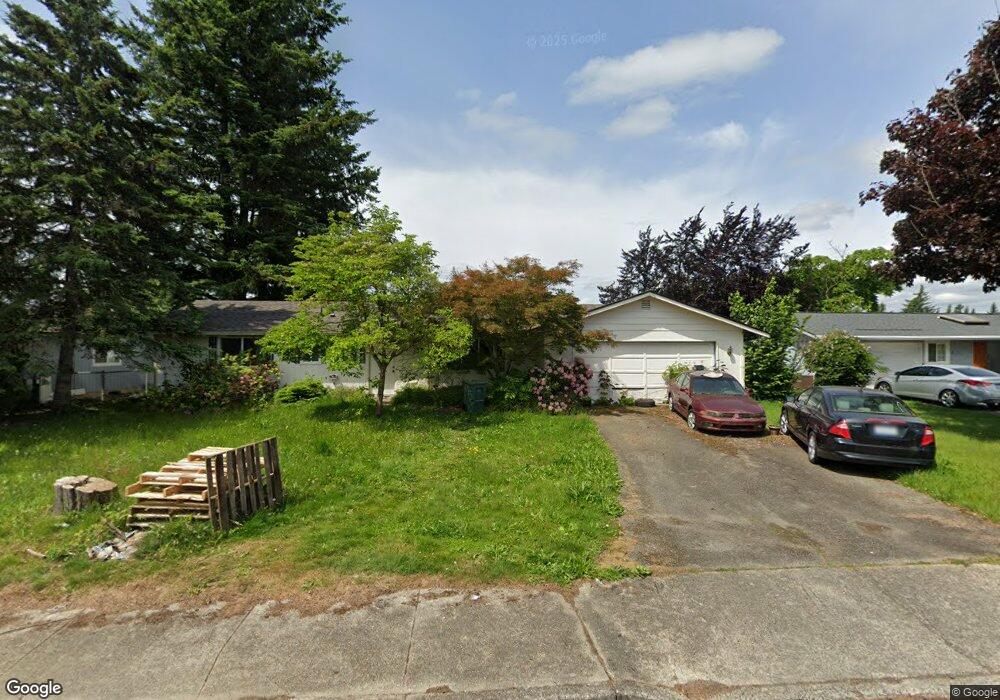
223 Pollman Cir Lynden, WA 98264
Estimated Value: $434,000 - $493,000
3
Beds
2
Baths
1,056
Sq Ft
$442/Sq Ft
Est. Value
About This Home
This home is located at 223 Pollman Cir, Lynden, WA 98264 and is currently estimated at $466,958, approximately $442 per square foot. 223 Pollman Cir is a home located in Whatcom County with nearby schools including Irene Reither Elementary School, Meridian Middle School, and Meridian High School.
Ownership History
Date
Name
Owned For
Owner Type
Purchase Details
Closed on
Jan 5, 2010
Sold by
Trujillo Adrian and Trujillo Gloria
Bought by
Dykstra Jessica L
Current Estimated Value
Home Financials for this Owner
Home Financials are based on the most recent Mortgage that was taken out on this home.
Original Mortgage
$171,830
Outstanding Balance
$111,781
Interest Rate
4.77%
Mortgage Type
FHA
Estimated Equity
$355,177
Purchase Details
Closed on
Apr 23, 2005
Sold by
Ahrens Neil E and Ahrens Gail
Bought by
Trujillo Adrian and Trujillo Gloria
Home Financials for this Owner
Home Financials are based on the most recent Mortgage that was taken out on this home.
Original Mortgage
$179,550
Interest Rate
5.92%
Mortgage Type
Fannie Mae Freddie Mac
Create a Home Valuation Report for This Property
The Home Valuation Report is an in-depth analysis detailing your home's value as well as a comparison with similar homes in the area
Home Values in the Area
Average Home Value in this Area
Purchase History
| Date | Buyer | Sale Price | Title Company |
|---|---|---|---|
| Dykstra Jessica L | $175,280 | Whatcom Land Title | |
| Trujillo Adrian | $189,000 | Whatcom Land Title |
Source: Public Records
Mortgage History
| Date | Status | Borrower | Loan Amount |
|---|---|---|---|
| Open | Dykstra Jessica L | $171,830 | |
| Previous Owner | Trujillo Adrian | $179,550 |
Source: Public Records
Tax History Compared to Growth
Tax History
| Year | Tax Paid | Tax Assessment Tax Assessment Total Assessment is a certain percentage of the fair market value that is determined by local assessors to be the total taxable value of land and additions on the property. | Land | Improvement |
|---|---|---|---|---|
| 2024 | $3,190 | $409,742 | $218,250 | $191,492 |
| 2023 | $3,190 | $409,127 | $225,000 | $184,127 |
| 2022 | $2,844 | $341,933 | $162,045 | $179,888 |
| 2021 | $2,777 | $282,586 | $133,920 | $148,666 |
| 2020 | $2,483 | $252,314 | $119,574 | $132,740 |
| 2019 | $2,176 | $226,202 | $107,199 | $119,003 |
| 2018 | $2,505 | $216,706 | $102,699 | $114,007 |
| 2017 | $2,351 | $189,910 | $90,000 | $99,910 |
| 2016 | $2,154 | $188,641 | $78,325 | $110,316 |
| 2015 | $2,074 | $171,936 | $72,475 | $99,461 |
| 2014 | -- | $160,558 | $67,275 | $93,283 |
| 2013 | -- | $153,253 | $65,000 | $88,253 |
Source: Public Records
Map
Nearby Homes
- 6852 Dutch Haven Dr
- 6830 Vail Dr
- 6818 Vail Dr
- 0 Old Guide Rd
- 7062 Guide Meridian Rd Unit 26
- 361 W Wiser Lake Rd
- 271 E Bartlett Rd
- 6864 Blumefield Dr
- 210 E Hemmi Rd
- 6732 La Bello Dr
- 6037 Old Guide Rd
- 6812 Golf View Dr Unit A
- 490 W Laurel Rd
- 6917 Red Ridge Dr
- 7025 Hannegan Rd
- 918 Citadel Dr
- 787 E Wiser Lake Rd
- 1257 Lattimore Rd
- 765 van Dyk Rd
- 7343 Hannegan Rd Unit 2
- 221 Pollman Cir
- 225 Pollman Cir
- 219 Pollman Cir
- 222 Pollman Cir
- 224 Pollman Cir
- 6839 Old Guide Rd
- 218 Pollman Cir
- 226 Pollman Cir
- 217 Pollman Cir
- 229 Pollman Cir
- 6847 Dutch Haven Dr
- 6839 Dutch Haven Dr
- 6863 Old Guide Rd
- 6851 Dutch Haven Dr
- 228 Pollman Cir
- 214 Pollman Cir
- 215 Pollman Cir
- 6835 Dutch Haven Dr
- 6853 Dutch Haven Dr