Estimated Value: $224,000 - $321,000
3
Beds
2
Baths
1,869
Sq Ft
$144/Sq Ft
Est. Value
About This Home
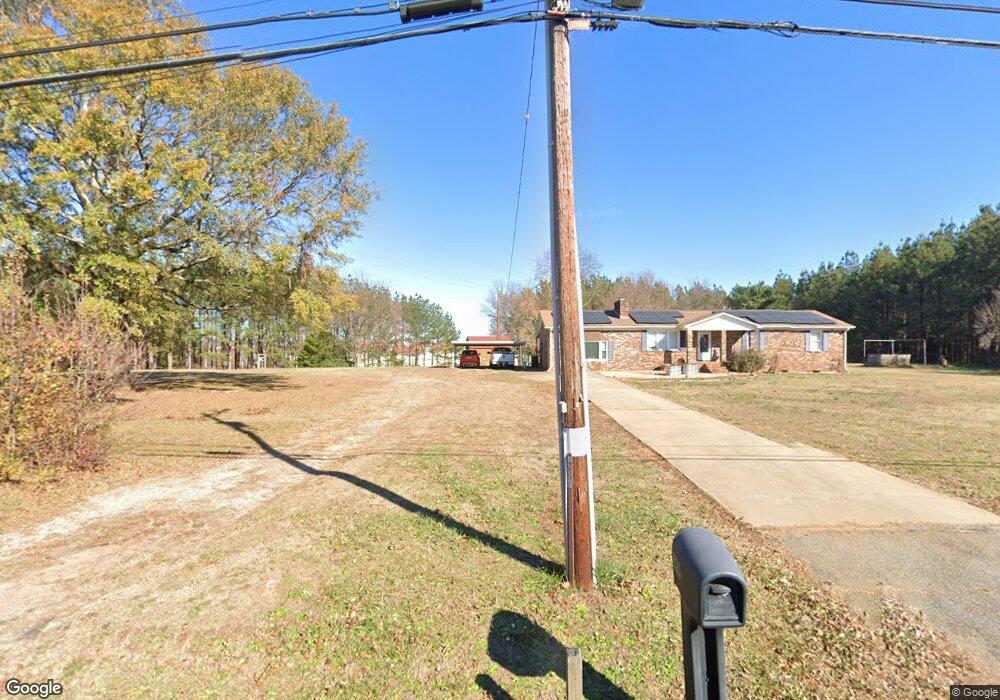
This home is located at 223 Victor Avenue Extension Unit 223, Greer, SC 29651 and is currently estimated at $269,313, approximately $144 per square foot. 223 Victor Avenue Extension Unit 223 is a home located in Spartanburg County with nearby schools including Chandler Creek Elementary School, Greer Middle School, and Greer High School.
Ownership History
Date
Name
Owned For
Owner Type
Purchase Details
Closed on
Aug 20, 2024
Sold by
Wucherer Phillip A
Bought by
Fuller Kayla R
Current Estimated Value
Purchase Details
Closed on
Jul 12, 2023
Sold by
Fuller Kayla
Bought by
Fuller Kayla R and Wucherer Phillip A
Purchase Details
Closed on
Oct 8, 2020
Sold by
Thorne Juanita
Bought by
Fuller Kayla
Purchase Details
Closed on
Oct 5, 2020
Sold by
Sanford Diane
Bought by
Fuller Kayla
Purchase Details
Closed on
Sep 9, 2020
Sold by
Estate Of Roy Fuller
Bought by
Fuller Kayla and Lanford Ronnie
Purchase Details
Closed on
Feb 24, 2020
Sold by
Bagwell Teresa L
Bought by
Sanford Diane
Purchase Details
Closed on
Sep 30, 2013
Sold by
Estate Of Thelma Marie Fuller
Bought by
Fuller Roy and Sanford Diane
Create a Home Valuation Report for This Property
The Home Valuation Report is an in-depth analysis detailing your home's value as well as a comparison with similar homes in the area
Home Values in the Area
Average Home Value in this Area
Purchase History
| Date | Buyer | Sale Price | Title Company |
|---|---|---|---|
| Fuller Kayla R | -- | None Listed On Document | |
| Fuller Kayla R | -- | None Listed On Document | |
| Fuller Kayla | $7,400 | None Available | |
| Fuller Kayla | $14,800 | None Available | |
| Fuller Kayla | $7,400 | None Available | |
| Fuller Kayla | $7,400 | None Available | |
| Fuller Kayla | $7,400 | None Available | |
| Fuller Kayla | $14,800 | None Available | |
| Fuller Kayla | -- | None Available | |
| Sanford Diane | -- | None Available | |
| Fuller Roy | -- | -- |
Source: Public Records
Tax History Compared to Growth
Tax History
| Year | Tax Paid | Tax Assessment Tax Assessment Total Assessment is a certain percentage of the fair market value that is determined by local assessors to be the total taxable value of land and additions on the property. | Land | Improvement |
|---|---|---|---|---|
| 2025 | $1,436 | $8,240 | $1,716 | $6,524 |
| 2024 | $1,436 | $8,240 | $1,716 | $6,524 |
| 2023 | $1,436 | $6,919 | $1,441 | $5,478 |
| 2022 | $1,102 | $6,016 | $1,252 | $4,764 |
| 2021 | $1,102 | $6,016 | $1,252 | $4,764 |
| 2020 | $833 | $6,016 | $1,252 | $4,764 |
| 2019 | $802 | $5,842 | $1,216 | $4,626 |
| 2018 | $802 | $5,842 | $1,216 | $4,626 |
| 2017 | $672 | $5,080 | $1,084 | $3,996 |
| 2016 | $655 | $5,080 | $1,084 | $3,996 |
| 2015 | $650 | $5,080 | $1,084 | $3,996 |
| 2014 | $562 | $5,080 | $1,084 | $3,996 |
Source: Public Records
Map
Nearby Homes
- 663 Millwright Way
- 635 Millwright Way
- 907 Yarn Way
- 814 Thread Way
- 822 Thread Way
- 123 Spruce Ave
- 00 New Woodruff Rd
- 200 Mcdaniel Ave
- 11 25th St
- 502 New Woodruff Rd Unit 500
- 847 Harvey Rd
- 451 Sunnyside Dr
- 225 Emerald Creek Ave
- 401 Morgan St
- 315 Eagle Mill Ln
- 307 Eagle Mill Ln
- 294 Morgan St
- 00 Morgan St
- 200 Broadus St
- 140 Broadus St
- 225 Victor Avenue Extension
- 226 Victor Avenue Extension
- 224 Victor Avenue Extension
- 224 Victor Avenue Extension
- 201 Victor Ave
- 101 Ashland Dr
- 105 Ashland Dr
- 107 Ashland Dr
- 300 Timberlane Rd
- 109 Ashland Dr
- 202 Victor Avenue Extension
- 100 Ashland Dr
- 302 Timberlane Rd
- 102 Ashland Dr
- 204 Timberlane Rd
- 104 Ashland Dr
- 304 Timberlane Rd
- 106 Ashland Dr
- 202 Timberlane Rd
- 301 Timberlane Rd