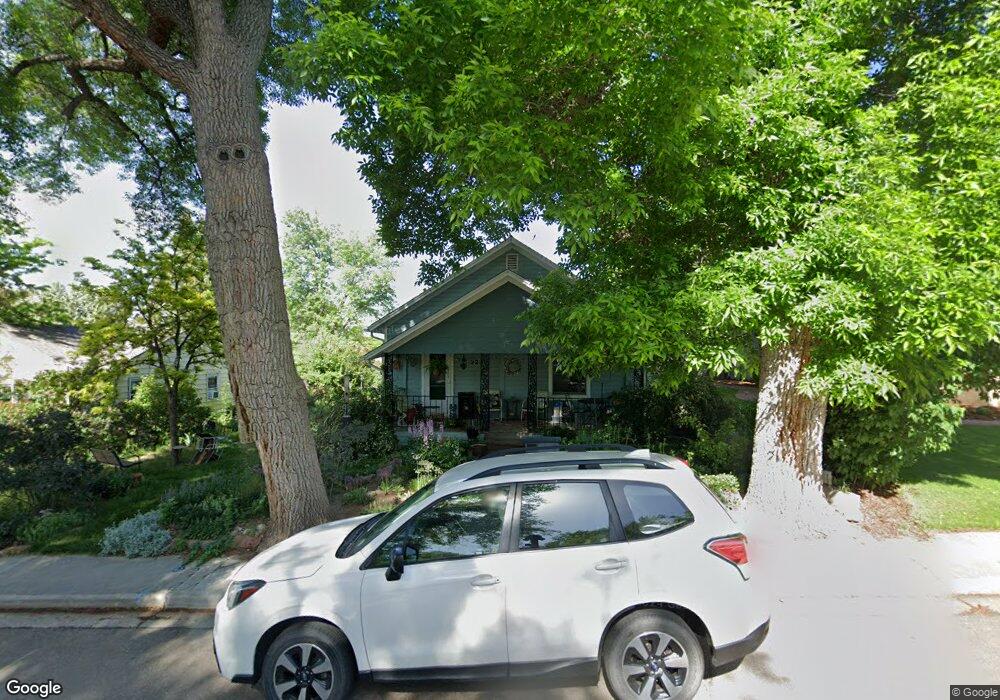
223 Vivian St Longmont, CO 80501
Sunset NeighborhoodEstimated Value: $422,864 - $574,000
2
Beds
1
Bath
728
Sq Ft
$689/Sq Ft
Est. Value
About This Home
This home is located at 223 Vivian St, Longmont, CO 80501 and is currently estimated at $501,716, approximately $689 per square foot. 223 Vivian St is a home located in Boulder County with nearby schools including Central Elementary School, Westview Middle School, and Longmont High School.
Ownership History
Date
Name
Owned For
Owner Type
Purchase Details
Closed on
May 19, 2000
Sold by
Kennedy Patrick John
Bought by
Kennedy Patrick John and Pache Stephanie Lee
Current Estimated Value
Home Financials for this Owner
Home Financials are based on the most recent Mortgage that was taken out on this home.
Original Mortgage
$161,100
Outstanding Balance
$55,655
Interest Rate
8.14%
Estimated Equity
$446,061
Purchase Details
Closed on
Jun 20, 1997
Sold by
Tregay Koschade Mark D and Tregay William J
Bought by
Klamer Maia
Home Financials for this Owner
Home Financials are based on the most recent Mortgage that was taken out on this home.
Original Mortgage
$103,530
Interest Rate
7.93%
Mortgage Type
FHA
Purchase Details
Closed on
Jul 19, 1993
Bought by
Kennedy Patrick John
Create a Home Valuation Report for This Property
The Home Valuation Report is an in-depth analysis detailing your home's value as well as a comparison with similar homes in the area
Home Values in the Area
Average Home Value in this Area
Purchase History
| Date | Buyer | Sale Price | Title Company |
|---|---|---|---|
| Kennedy Patrick John | -- | -- | |
| Kennedy Patrick John | $179,000 | Heritage Title | |
| Klamer Maia | $113,000 | Land Title | |
| Kennedy Patrick John | $54,900 | -- |
Source: Public Records
Mortgage History
| Date | Status | Borrower | Loan Amount |
|---|---|---|---|
| Open | Kennedy Patrick John | $161,100 | |
| Previous Owner | Klamer Maia | $103,530 |
Source: Public Records
Tax History Compared to Growth
Tax History
| Year | Tax Paid | Tax Assessment Tax Assessment Total Assessment is a certain percentage of the fair market value that is determined by local assessors to be the total taxable value of land and additions on the property. | Land | Improvement |
|---|---|---|---|---|
| 2025 | $2,689 | $30,750 | $9,794 | $20,956 |
| 2024 | $2,689 | $30,750 | $9,794 | $20,956 |
| 2023 | $2,652 | $28,113 | $10,955 | $20,844 |
| 2022 | $2,435 | $24,610 | $8,006 | $16,604 |
| 2021 | $2,467 | $25,318 | $8,237 | $17,081 |
| 2020 | $2,323 | $23,910 | $6,435 | $17,475 |
| 2019 | $2,286 | $23,910 | $6,435 | $17,475 |
| 2018 | $1,840 | $19,375 | $7,416 | $11,959 |
| 2017 | $1,815 | $21,421 | $8,199 | $13,222 |
| 2016 | $1,685 | $17,623 | $9,472 | $8,151 |
| 2015 | $1,605 | $13,946 | $4,298 | $9,648 |
| 2014 | $1,303 | $13,946 | $4,298 | $9,648 |
Source: Public Records
Map
Nearby Homes
- 1701 Short Place
- 159 Judson St
- 1421 Spruce Ave
- 140 Judson St
- 103 Sunset St Unit A
- 150 Francis St
- 1 Sherman Ct
- 402 Sherman St
- 1301 Spruce Ave
- 207 Lincoln St
- 746 Sumner St
- 305 Cottonwood Ct
- 813 Vivian St
- 1129 2nd Ave
- 895 Faith Ct
- 707 Longs Peak Ln
- 818 Lincoln St
- 301 Widgeon Ln
- 309 Sheley Ct Unit 98
- 715 Hover St