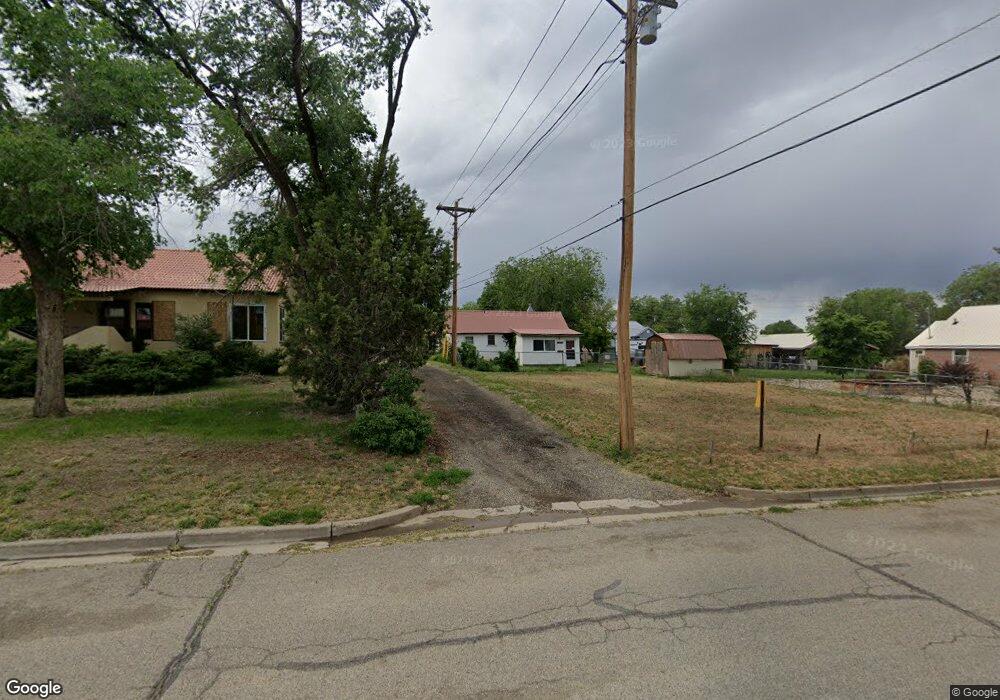
223 W Arbecam Ave Cortez, CO 81321
Estimated Value: $163,000 - $204,923
2
Beds
1
Bath
826
Sq Ft
$222/Sq Ft
Est. Value
About This Home
This home is located at 223 W Arbecam Ave, Cortez, CO 81321 and is currently estimated at $182,981, approximately $221 per square foot. 223 W Arbecam Ave is a home located in Montezuma County with nearby schools including Montezuma-Cortez High School, Children's Kiva Montessori School, and Children's Kiva Montessori Preschool & Kindergarten.
Ownership History
Date
Name
Owned For
Owner Type
Purchase Details
Closed on
Oct 10, 2024
Sold by
Carver Debra Diane and Neely Melody A
Bought by
Carras Matthew W
Current Estimated Value
Home Financials for this Owner
Home Financials are based on the most recent Mortgage that was taken out on this home.
Original Mortgage
$165,000
Outstanding Balance
$163,265
Interest Rate
6.35%
Mortgage Type
VA
Estimated Equity
$19,716
Purchase Details
Closed on
Nov 22, 2010
Sold by
Hurt Thyra Diane
Bought by
Sackett Robert and Neely Melody
Purchase Details
Closed on
Dec 7, 2004
Sold by
Hurt Thyra Diane
Bought by
Neely Melody A and Sackett David D
Purchase Details
Closed on
Nov 29, 2004
Sold by
Hurt Thyra Diane
Bought by
Neely Melody A and Sackett David D
Purchase Details
Closed on
Feb 16, 1999
Sold by
Dawson Inez
Bought by
Hurt Thyra Diane
Create a Home Valuation Report for This Property
The Home Valuation Report is an in-depth analysis detailing your home's value as well as a comparison with similar homes in the area
Home Values in the Area
Average Home Value in this Area
Purchase History
| Date | Buyer | Sale Price | Title Company |
|---|---|---|---|
| Carras Matthew W | $165,000 | None Listed On Document | |
| Sackett Robert | -- | None Available | |
| Neely Melody A | -- | -- | |
| Neely Melody A | -- | -- | |
| Hurt Thyra Diane | -- | -- |
Source: Public Records
Mortgage History
| Date | Status | Borrower | Loan Amount |
|---|---|---|---|
| Open | Carras Matthew W | $165,000 |
Source: Public Records
Tax History Compared to Growth
Tax History
| Year | Tax Paid | Tax Assessment Tax Assessment Total Assessment is a certain percentage of the fair market value that is determined by local assessors to be the total taxable value of land and additions on the property. | Land | Improvement |
|---|---|---|---|---|
| 2024 | $468 | $9,097 | $1,670 | $7,427 |
| 2023 | $468 | $13,475 | $2,474 | $11,001 |
| 2022 | $440 | $9,085 | $1,130 | $7,955 |
| 2021 | $447 | $9,085 | $1,130 | $7,955 |
| 2020 | $385 | $8,136 | $1,242 | $6,894 |
| 2019 | $386 | $8,136 | $1,242 | $6,894 |
| 2018 | $403 | $6,320 | $1,120 | $5,200 |
| 2017 | $401 | $6,320 | $1,120 | $5,200 |
| 2016 | $362 | $6,300 | $1,240 | $5,060 |
| 2015 | $332 | $91,830 | $0 | $0 |
| 2014 | $387 | $6,300 | $0 | $0 |
Source: Public Records
Map
Nearby Homes
- 235 N Chestnut St Unit 6
- 240 N Elm St
- 409 N Broadway
- 210 W Coronado Ave
- 537 N Elm St
- 23 E Montezuma Ave
- 102 E Montezuma Ave
- 115 S Linden St
- 521 N Beech St
- Tract 9 N Broadway
- 416 N Ash St
- 323 N Washington St
- 122 E 1st St Unit see broker remarks
- 243 N Madison St
- 125 N Madison St
- 420 W 4th St
- 201 S Washington St
- 417 S Oak St
- 306 S Ash St
- 145 S Madison St
- 223 N Elm St
- 240 N Linden St
- 215 W Arbecam Ave
- 212 W Montezuma Ave
- 218 W Montezuma Ave
- 208 W Montezuma Ave
- 219 N Elm St
- 307 W Arbecam Ave
- 220 W Arbecam Ave
- 200 W Arbecam Ave
- 233 N Elm St
- N Linden St
- 219 N Linden St
- N N Elm St
- 215 N Linden St
- 307 N Elm St
- 318 N Linden St
- 301 N Linden St
- 226 N Elm St
- 222 N Elm St