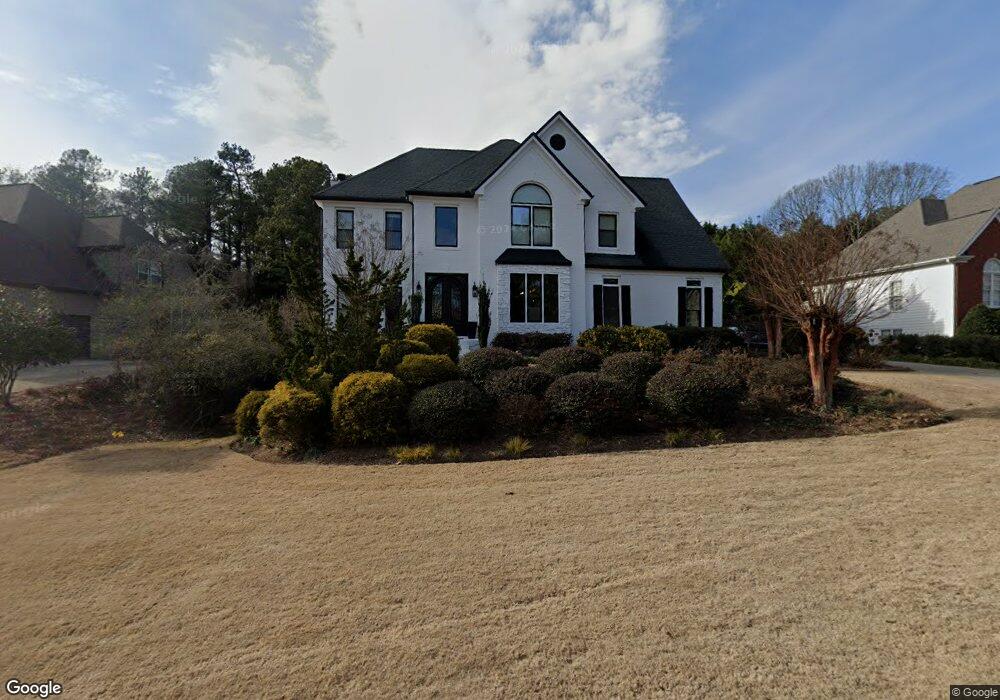
2230 Bricker Ct Cumming, GA 30041
Big Creek NeighborhoodEstimated Value: $662,000 - $738,000
4
Beds
3
Baths
2,706
Sq Ft
$261/Sq Ft
Est. Value
About This Home
This home is located at 2230 Bricker Ct, Cumming, GA 30041 and is currently estimated at $706,576, approximately $261 per square foot. 2230 Bricker Ct is a home located in Forsyth County with nearby schools including Sharon Elementary School, South Forsyth Middle School, and South Forsyth High School.
Ownership History
Date
Name
Owned For
Owner Type
Purchase Details
Closed on
Sep 27, 2002
Sold by
Heath Timothy J and Heath Linda S
Bought by
Roeder Rachel M
Current Estimated Value
Home Financials for this Owner
Home Financials are based on the most recent Mortgage that was taken out on this home.
Original Mortgage
$210,400
Outstanding Balance
$88,337
Interest Rate
6.18%
Mortgage Type
New Conventional
Estimated Equity
$618,239
Purchase Details
Closed on
Jan 22, 1999
Sold by
Con & Structual Enterprises Inc
Bought by
Heath Timothy J and Heath Linda S
Home Financials for this Owner
Home Financials are based on the most recent Mortgage that was taken out on this home.
Original Mortgage
$176,200
Interest Rate
6.72%
Mortgage Type
New Conventional
Purchase Details
Closed on
Jul 10, 1998
Sold by
Donaldson & Assoc
Bought by
Con Structual Ent Inc
Home Financials for this Owner
Home Financials are based on the most recent Mortgage that was taken out on this home.
Original Mortgage
$158,000
Interest Rate
7.02%
Mortgage Type
New Conventional
Create a Home Valuation Report for This Property
The Home Valuation Report is an in-depth analysis detailing your home's value as well as a comparison with similar homes in the area
Home Values in the Area
Average Home Value in this Area
Purchase History
| Date | Buyer | Sale Price | Title Company |
|---|---|---|---|
| Roeder Rachel M | $263,000 | -- | |
| Heath Timothy J | $220,300 | -- | |
| Con Structual Ent Inc | $39,800 | -- |
Source: Public Records
Mortgage History
| Date | Status | Borrower | Loan Amount |
|---|---|---|---|
| Open | Roeder Rachel M | $210,400 | |
| Closed | Roeder Rachel M | $39,450 | |
| Previous Owner | Heath Timothy J | $176,200 | |
| Previous Owner | Con Structual Ent Inc | $158,000 |
Source: Public Records
Tax History Compared to Growth
Tax History
| Year | Tax Paid | Tax Assessment Tax Assessment Total Assessment is a certain percentage of the fair market value that is determined by local assessors to be the total taxable value of land and additions on the property. | Land | Improvement |
|---|---|---|---|---|
| 2025 | $4,938 | $246,804 | $68,000 | $178,804 |
| 2024 | $4,938 | $251,024 | $60,000 | $191,024 |
| 2023 | $4,259 | $230,920 | $60,000 | $170,920 |
| 2022 | $3,910 | $154,756 | $40,000 | $114,756 |
| 2021 | $3,776 | $154,756 | $40,000 | $114,756 |
| 2020 | $3,660 | $149,156 | $40,000 | $109,156 |
| 2019 | $3,648 | $148,292 | $40,000 | $108,292 |
| 2018 | $3,303 | $130,908 | $28,000 | $102,908 |
| 2017 | $3,082 | $119,804 | $28,000 | $91,804 |
| 2016 | $2,913 | $111,804 | $20,000 | $91,804 |
| 2015 | $2,918 | $111,804 | $20,000 | $91,804 |
| 2014 | $2,396 | $93,780 | $0 | $0 |
Source: Public Records
Map
Nearby Homes
- 2615 Hillandale Cir
- 2560 Hillandale Cir
- 2540 Hillandale Cir
- 1760 Commonwealth Trail
- Davis Plan at Sterling Pointe
- Ward Plan at Sterling Pointe
- Richmond Plan at Sterling Pointe
- Valley Plan at Sterling Pointe
- Waterstone Plan at Sterling Pointe
- 2260 Thames Ct
- The Oxford Plan at Windsor Bluffs
- The Cambridge Plan at Windsor Bluffs
- The Berkshire Plan at Windsor Bluffs
- 2250 Thames Ct
- 2255 Windsor Bluffs Dr
- 2545 Bertrand Way
- 2560 Bertrand Way
- 2335 Flat Stone Dr
- 3090 Florence St
- 3055 Florence St
- 2220 Bricker Ct
- 2240 Bricker Ct
- 2235 Bricker Ct
- 2210 Bricker Ct
- 2250 Bricker Ct
- 2215 Bricker Ct
- 2245 Bricker Ct
- 2260 Bricker Ct
- 2115 Brookton Way
- 2120 Arbor Chase
- 2255 Bricker Ct
- 2180 Bricker Ct
- 2130 Brookton Way
- 2140 Arbor Chase
- 0 Bricker Ct Unit 3248990
- 0 Bricker Ct Unit 7210249
- 0 Bricker Ct Unit 7258012
- 2170 Bricker Ct
- 2065 Hemrick Rd
- 2120 Brookton Way Unit II