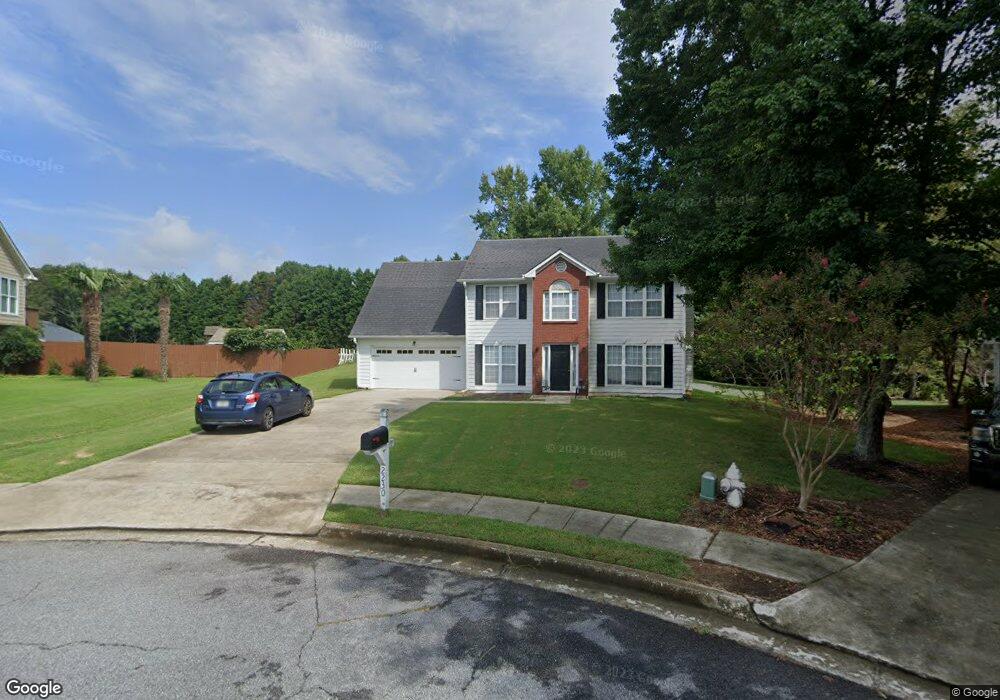
2230 Leighs Brook Ct Dacula, GA 30019
Estimated Value: $395,000 - $448,026
4
Beds
3
Baths
2,031
Sq Ft
$205/Sq Ft
Est. Value
About This Home
This home is located at 2230 Leighs Brook Ct, Dacula, GA 30019 and is currently estimated at $415,507, approximately $204 per square foot. 2230 Leighs Brook Ct is a home located in Gwinnett County with nearby schools including Alcova Elementary School, Dacula Middle School, and Dacula High School.
Ownership History
Date
Name
Owned For
Owner Type
Purchase Details
Closed on
Aug 28, 2024
Sold by
Open House Atlanta Realty & Investments
Bought by
Gujo Living Service Co Ltd
Current Estimated Value
Home Financials for this Owner
Home Financials are based on the most recent Mortgage that was taken out on this home.
Original Mortgage
$283,200
Outstanding Balance
$259,274
Interest Rate
6.89%
Mortgage Type
New Conventional
Estimated Equity
$156,233
Purchase Details
Closed on
Nov 20, 2023
Sold by
Williams James R
Bought by
Open House Atlanta Realty & Investments
Purchase Details
Closed on
Jun 27, 1997
Sold by
Simway Homes
Bought by
Williams James R and Williams Emily A
Home Financials for this Owner
Home Financials are based on the most recent Mortgage that was taken out on this home.
Original Mortgage
$113,250
Interest Rate
7.7%
Mortgage Type
New Conventional
Create a Home Valuation Report for This Property
The Home Valuation Report is an in-depth analysis detailing your home's value as well as a comparison with similar homes in the area
Home Values in the Area
Average Home Value in this Area
Purchase History
| Date | Buyer | Sale Price | Title Company |
|---|---|---|---|
| Gujo Living Service Co Ltd | $472,000 | -- | |
| Open House Atlanta Realty & Investments | $339,000 | -- | |
| Williams James R | $119,300 | -- |
Source: Public Records
Mortgage History
| Date | Status | Borrower | Loan Amount |
|---|---|---|---|
| Open | Gujo Living Service Co Ltd | $283,200 | |
| Previous Owner | Williams James R | $113,250 |
Source: Public Records
Tax History Compared to Growth
Tax History
| Year | Tax Paid | Tax Assessment Tax Assessment Total Assessment is a certain percentage of the fair market value that is determined by local assessors to be the total taxable value of land and additions on the property. | Land | Improvement |
|---|---|---|---|---|
| 2025 | $5,120 | $135,840 | $26,120 | $109,720 |
| 2024 | $4,271 | $110,280 | $26,400 | $83,880 |
| 2023 | $4,271 | $134,920 | $30,000 | $104,920 |
| 2022 | $3,185 | $116,680 | $27,200 | $89,480 |
| 2021 | $2,482 | $80,960 | $18,000 | $62,960 |
| 2020 | $2,500 | $80,960 | $18,000 | $62,960 |
| 2019 | $2,325 | $75,400 | $18,000 | $57,400 |
| 2018 | $2,150 | $67,360 | $15,600 | $51,760 |
| 2016 | $1,925 | $55,960 | $13,600 | $42,360 |
| 2015 | $1,740 | $46,760 | $8,800 | $37,960 |
| 2014 | -- | $46,760 | $8,800 | $37,960 |
Source: Public Records
Map
Nearby Homes
- 1031 Jordan Rd
- 2088 Woodland Brook Dr
- 998 Mitford Ln
- 2106 Waycross Ln
- 2126 Waycross Ln
- 2200 Spruce Lake Dr
- 976 Redstone Rd
- 2276 Waycross Ln
- 1091 Harbins Rd
- 1072 Harbins Rd
- 1211 Chapel Estates Way
- 1985 Chapel Estates Ln
- 1042 Harbins Rd
- 1112 Harbins Rd
- 2015 Chapel Estates Ln SE
- 2205 Chant St
- 1092 Harbins Rd
- 2235 Leighs Brook Ct
- 2210 Leighs Brook Ct
- 0 Leighs Brook Ct Unit 7086533
- 2225 Leighs Brook Ct
- 2200 Leighs Brook Ct
- 2215 Leighs Brook Ct
- 910 Leighs Brook Way
- 950 Leighs Brook Way
- 960 Leighs Brook Way
- 980 Leighs Brook Way
- 925 Leighs Brook Way
- 955 Leighs Brook Way
- 935 Leighs Brook Way
- 915 Leighs Brook Way
- 900 Leighs Brook Way
- 926 Jordan Rd
- 945 Leighs Brook Way
- 0 Leighs Brook Way Unit 7442380
- 0 Leighs Brook Way Unit 7144297
- 965 Leighs Brook Way