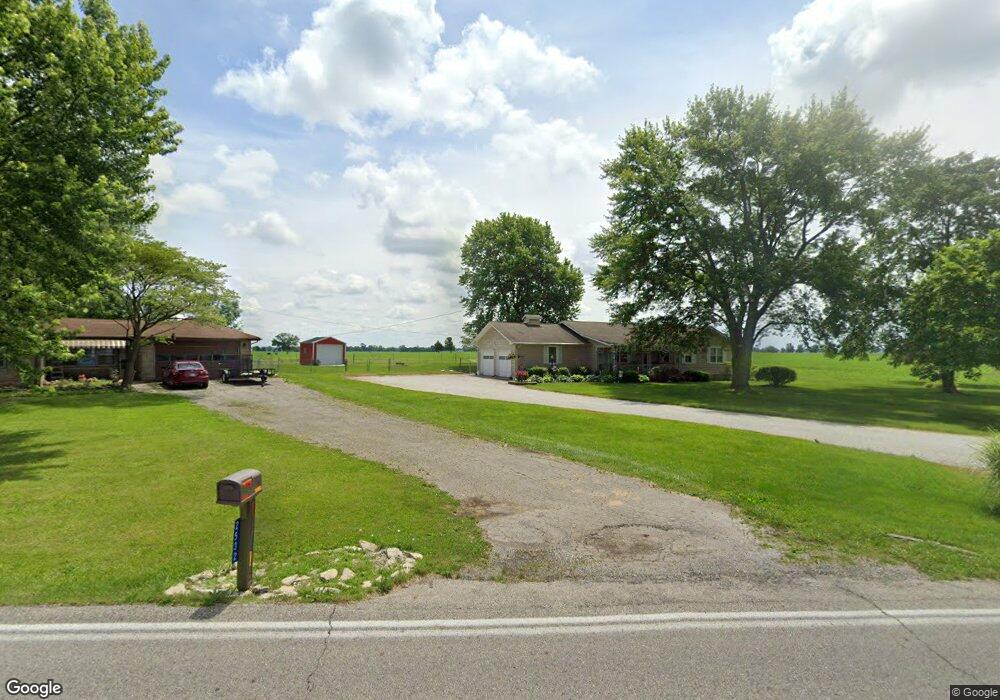
2230 Smithland Rd Shelbyville, IN 46176
Estimated Value: $226,000 - $260,000
4
Beds
2
Baths
1,874
Sq Ft
$127/Sq Ft
Est. Value
About This Home
This home is located at 2230 Smithland Rd, Shelbyville, IN 46176 and is currently estimated at $238,044, approximately $127 per square foot. 2230 Smithland Rd is a home located in Shelby County with nearby schools including Thomas A. Hendricks Elementary School, Shelbyville Middle School, and Shelbyville Senior High School.
Ownership History
Date
Name
Owned For
Owner Type
Purchase Details
Closed on
Apr 16, 2015
Sold by
Mohr Carl I and Mohr Linda D
Bought by
Mohr Linda D and The Linda D Mohr Living Trust
Current Estimated Value
Home Financials for this Owner
Home Financials are based on the most recent Mortgage that was taken out on this home.
Original Mortgage
$88,369
Interest Rate
4.5%
Mortgage Type
FHA
Purchase Details
Closed on
Apr 3, 2015
Sold by
Robert L & Pansy Stevens Revocable Living Tru
Bought by
Anderson Heath R
Home Financials for this Owner
Home Financials are based on the most recent Mortgage that was taken out on this home.
Original Mortgage
$88,369
Interest Rate
4.5%
Mortgage Type
FHA
Purchase Details
Closed on
Sep 8, 2010
Sold by
Lsf6 Mercury Reo Investments Trust Serie
Bought by
Stevens Robert L and Stevens Pansy
Purchase Details
Closed on
Apr 1, 2010
Sold by
Araujo Jonathan J
Bought by
Lsf6 Mercury Reo Investments Trust
Create a Home Valuation Report for This Property
The Home Valuation Report is an in-depth analysis detailing your home's value as well as a comparison with similar homes in the area
Home Values in the Area
Average Home Value in this Area
Purchase History
| Date | Buyer | Sale Price | Title Company |
|---|---|---|---|
| Mohr Linda D | -- | None Available | |
| Anderson Heath R | $90,000 | -- | |
| Anderson Heath R | -- | None Available | |
| Stevens Robert L | -- | -- | |
| Lsf6 Mercury Reo Investments Trust | $42,322 | -- |
Source: Public Records
Mortgage History
| Date | Status | Borrower | Loan Amount |
|---|---|---|---|
| Previous Owner | Anderson Heath R | $88,369 |
Source: Public Records
Tax History Compared to Growth
Tax History
| Year | Tax Paid | Tax Assessment Tax Assessment Total Assessment is a certain percentage of the fair market value that is determined by local assessors to be the total taxable value of land and additions on the property. | Land | Improvement |
|---|---|---|---|---|
| 2024 | $1,468 | $146,800 | $17,500 | $129,300 |
| 2023 | $1,420 | $142,000 | $17,500 | $124,500 |
| 2022 | $1,465 | $146,500 | $17,500 | $129,000 |
| 2021 | $1,202 | $120,200 | $17,500 | $102,700 |
| 2020 | $1,162 | $116,200 | $17,500 | $98,700 |
| 2019 | $961 | $101,400 | $15,300 | $86,100 |
| 2018 | $833 | $93,700 | $13,900 | $79,800 |
| 2017 | $790 | $91,900 | $13,900 | $78,000 |
| 2016 | $788 | $91,900 | $13,900 | $78,000 |
| 2014 | $2,191 | $109,100 | $13,900 | $95,200 |
| 2013 | $2,191 | $109,100 | $13,900 | $95,200 |
Source: Public Records
Map
Nearby Homes
- 2135 S Miller Ave
- 2110 Kent Rd
- 2840 S 200 W
- 1221 Ruby Dr
- 1034 Fallway Dr
- 2309 Premier St
- 2867 S Oakland Dr
- 931 W Mckay Rd
- 911 Hale Rd Unit 65
- 1301 State St
- 2014 Meridian St
- 1121 W Washington Ave
- 755 2nd St
- 842 Miller Ave
- 1101 S Shelby St
- 3768 S 275 W
- 1051 Meridian St
- 629 S Miller St
- 430 W Locust St
- 714 W Washington St
- 0000 S Smithland Rd
- 2236 Smithland Rd
- 2242 Smithland Rd
- 2652 S Miller Ave
- 2212 Smithland Rd
- 2589 S Miller Ave
- 2542 S Miller Ave
- 2547 S Miller Ave
- 2441 S Tucker Rd
- 2530 S Miller Ave
- 2423 S Tucker Rd
- 2545 S Miller Ave
- 2504 S Miller Ave
- 2391 S Tucker Rd
- 2381 S Tucker Rd
- 2406 S Miller Ave
- 2409 S Tucker Rd
- 2478 S Miller Ave
- 1416 W 250 S
- 2355 S Tucker Rd