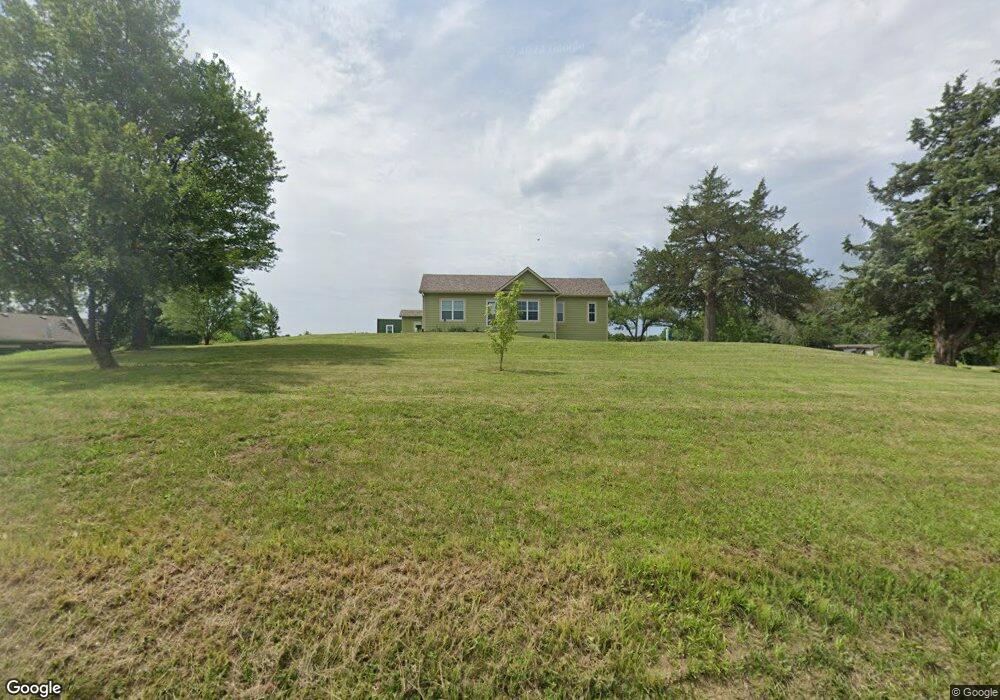
22309 Loring Rd Linwood, KS 66052
Estimated Value: $406,000 - $616,000
3
Beds
3
Baths
1,258
Sq Ft
$381/Sq Ft
Est. Value
About This Home
This home is located at 22309 Loring Rd, Linwood, KS 66052 and is currently estimated at $479,839, approximately $381 per square foot. 22309 Loring Rd is a home located in Leavenworth County with nearby schools including Tonganoxie Elementary School, Tonganoxie Middle School, and Tonganoxie High School.
Ownership History
Date
Name
Owned For
Owner Type
Purchase Details
Closed on
Feb 27, 2020
Sold by
Precision Contracting & Development Inc
Bought by
Pettengill Caleb J and Frehe Sarah J
Current Estimated Value
Home Financials for this Owner
Home Financials are based on the most recent Mortgage that was taken out on this home.
Original Mortgage
$253,816
Outstanding Balance
$225,215
Interest Rate
3.6%
Mortgage Type
New Conventional
Estimated Equity
$254,624
Purchase Details
Closed on
Jul 22, 2019
Sold by
John E Pettengill & Te Trust
Bought by
Precision Contracting & Dev In
Home Financials for this Owner
Home Financials are based on the most recent Mortgage that was taken out on this home.
Original Mortgage
$221,683
Interest Rate
3.82%
Mortgage Type
Construction
Purchase Details
Closed on
Feb 1, 2018
Sold by
Pettengill John E and Pettengill Teresa A
Bought by
Pettengill John E and Pettengill Teresa A
Create a Home Valuation Report for This Property
The Home Valuation Report is an in-depth analysis detailing your home's value as well as a comparison with similar homes in the area
Home Values in the Area
Average Home Value in this Area
Purchase History
| Date | Buyer | Sale Price | Title Company |
|---|---|---|---|
| Pettengill Caleb J | $337,575 | New Title Company Name | |
| Precision Contracting & Dev In | $277,103 | Security First Title | |
| Precision Contracting And Deve | $294,838 | New Title Company Name | |
| Pettengill John E | -- | None Listed On Document | |
| John E Pettengill & Teresa A Pettengill Livin | -- | None Listed On Document |
Source: Public Records
Mortgage History
| Date | Status | Borrower | Loan Amount |
|---|---|---|---|
| Open | Pettengill Caleb J | $253,816 | |
| Previous Owner | Precision Contracting And Deve | $221,683 |
Source: Public Records
Tax History Compared to Growth
Tax History
| Year | Tax Paid | Tax Assessment Tax Assessment Total Assessment is a certain percentage of the fair market value that is determined by local assessors to be the total taxable value of land and additions on the property. | Land | Improvement |
|---|---|---|---|---|
| 2025 | $4,745 | $42,136 | $6,962 | $35,174 |
| 2024 | $4,525 | $40,516 | $6,385 | $34,131 |
| 2023 | $4,525 | $38,592 | $6,637 | $31,955 |
| 2022 | $4,073 | $34,029 | $5,318 | $28,711 |
| 2021 | $3,567 | $29,238 | $4,743 | $24,495 |
| 2020 | $3,237 | $26,473 | $4,626 | $21,847 |
| 2019 | $1,280 | $10,805 | $4,626 | $6,179 |
| 2018 | $970 | $8,259 | $3,476 | $4,783 |
| 2017 | $889 | $7,553 | $3,016 | $4,537 |
| 2016 | $856 | $7,270 | $2,723 | $4,547 |
| 2015 | $803 | $6,869 | $2,723 | $4,146 |
| 2014 | $726 | $6,382 | $2,731 | $3,651 |
Source: Public Records
Map
Nearby Homes
- 13139 222nd St
- 22090 Linwood Rd
- 21535 Loring Rd
- 21881 Cantrell Rd
- 12314 222nd St
- Lot 5 238th St
- Lot 5 206th St
- 00000 Lot 9 South 206th St
- 00000 Lot 8 South 206th St
- 00000 Lot 2 North 206th St
- Lot 1 Cantrell Rd
- Lot 9 Cantrell Rd
- Lot 10 Cantrell Rd
- Lot 11 Cantrell Rd
- Lot 12 Cantrell Rd
- Lot 8 Cantrell Rd
- 24305 Loring Rd
- 22201 Woodend Rd
- 11509 238th St
- 23436 Guthrie Rd
- 22281 Loring Rd
- 22471 Loring Rd
- 13103 222nd St
- 13234 222nd St
- 13132 222nd St
- 22125 Loring Rd
- 13102 222nd St
- 13262 222nd St
- 13021 222nd St
- 13302 222nd St
- 13036 222nd St
- 13405 222nd St
- 12988 222nd St
- 22049 Loring Rd
- 13475 222nd St
- 22014 Loring Rd
- 22612 Loring Rd
- 13525 222nd St
- 12936 222nd St
- 12828 222nd St