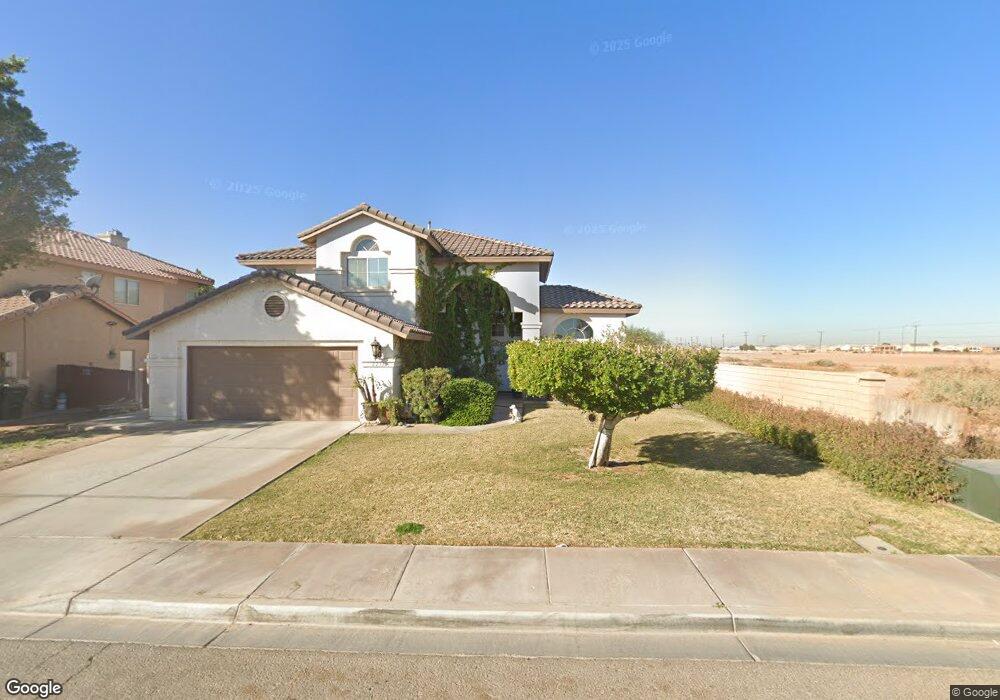
2231 I Yturralde Dr Calexico, CA 92231
Estimated Value: $482,000 - $499,000
4
Beds
3
Baths
2,239
Sq Ft
$218/Sq Ft
Est. Value
About This Home
This home is located at 2231 I Yturralde Dr, Calexico, CA 92231 and is currently estimated at $488,800, approximately $218 per square foot. 2231 I Yturralde Dr is a home located in Imperial County with nearby schools including Cesar Chavez Elementary School, Enrique Camarena Junior High School, and Calexico High School.
Ownership History
Date
Name
Owned For
Owner Type
Purchase Details
Closed on
Jun 22, 2022
Sold by
Retamoza Arias Leticia
Bought by
Arias Leticia Retamoza
Current Estimated Value
Home Financials for this Owner
Home Financials are based on the most recent Mortgage that was taken out on this home.
Original Mortgage
$205,000
Outstanding Balance
$195,893
Interest Rate
5.78%
Mortgage Type
Balloon
Estimated Equity
$292,907
Purchase Details
Closed on
Oct 26, 2005
Sold by
Valdez Raul Chiang and Arias Leticia Retamoza
Bought by
Arias Leticia Retamoza
Purchase Details
Closed on
May 15, 2002
Sold by
Victoria Place Llc
Bought by
Valdez Raul Chiang and Arias Leticia Retamoza
Home Financials for this Owner
Home Financials are based on the most recent Mortgage that was taken out on this home.
Original Mortgage
$111,990
Interest Rate
6.29%
Mortgage Type
Purchase Money Mortgage
Create a Home Valuation Report for This Property
The Home Valuation Report is an in-depth analysis detailing your home's value as well as a comparison with similar homes in the area
Purchase History
| Date | Buyer | Sale Price | Title Company |
|---|---|---|---|
| Arias Leticia Retamoza | -- | -- | |
| Arias Leticia Retamoza | -- | Chicago Title Co | |
| Valdez Raul Chiang | $187,000 | First American Title Ins Co |
Source: Public Records
Mortgage History
| Date | Status | Borrower | Loan Amount |
|---|---|---|---|
| Open | Arias Leticia Retamoza | $205,000 | |
| Previous Owner | Valdez Raul Chiang | $111,990 |
Source: Public Records
Tax History
| Year | Tax Paid | Tax Assessment Tax Assessment Total Assessment is a certain percentage of the fair market value that is determined by local assessors to be the total taxable value of land and additions on the property. | Land | Improvement |
|---|---|---|---|---|
| 2025 | $3,202 | $270,822 | $55,025 | $215,797 |
| 2023 | $3,202 | $260,308 | $52,890 | $207,418 |
| 2022 | $3,098 | $255,204 | $51,853 | $203,351 |
| 2021 | $3,005 | $250,201 | $50,837 | $199,364 |
| 2020 | $2,893 | $247,636 | $50,316 | $197,320 |
| 2019 | $2,808 | $242,781 | $49,330 | $193,451 |
| 2018 | $2,780 | $238,021 | $48,363 | $189,658 |
| 2017 | $2,578 | $233,355 | $47,415 | $185,940 |
| 2016 | $2,457 | $228,781 | $46,486 | $182,295 |
| 2015 | $2,414 | $225,345 | $45,788 | $179,557 |
| 2014 | $1,922 | $181,500 | $36,880 | $144,620 |
Source: Public Records
Map
Nearby Homes
- 1000 E Cole Rd
- 0 E Cole Rd Unit Lot 1 250029524
- 1179 Cabana St
- 1900 Rancho Frontera Ave Unit D25
- 1900 Rancho Frontera Ave Unit H59
- 1043 Playa Del Norte
- 950 Santa Ana St
- 1160 Rosas St Unit 152
- 1301 W Calle de Oro
- 248 Hernandez St
- 1245 C N Perry Rd
- 0 Avenida de Oro
- 839 E Cole Blvd
- 1213 C N Perry Rd
- 711 N Preston Dr
- 1237 D Hinojosa St
- 0 California 98
- 1070 Heber Ave
- 816 Beach Ave
- 1061 Heber Ave
- 2225 I Yturralde Dr
- 2224 A Hems Ct
- 2230 A Hems Ct
- 2219 I Yturralde Dr
- 2248 I Yturralde Dr
- 2252 I Yturralde Dr
- 2236 I Yturralde Dr
- 2218 A Hems Ct
- 2258 I Yturralde Dr
- 2213 I Yturralde Dr
- 2230 I Yturralde Dr
- 2264 I Yturralde Dr
- 2231 A Hems Ct
- 2224 I Yturralde Dr
- 2212 A Hems Ct
- 2272 I Yturralde Dr Unit 4
- 2249 Camino Dr
- 2243 Camino Dr
- 2255 Camino Dr
- 2237 Camino Dr
Your Personal Tour Guide
Ask me questions while you tour the home.