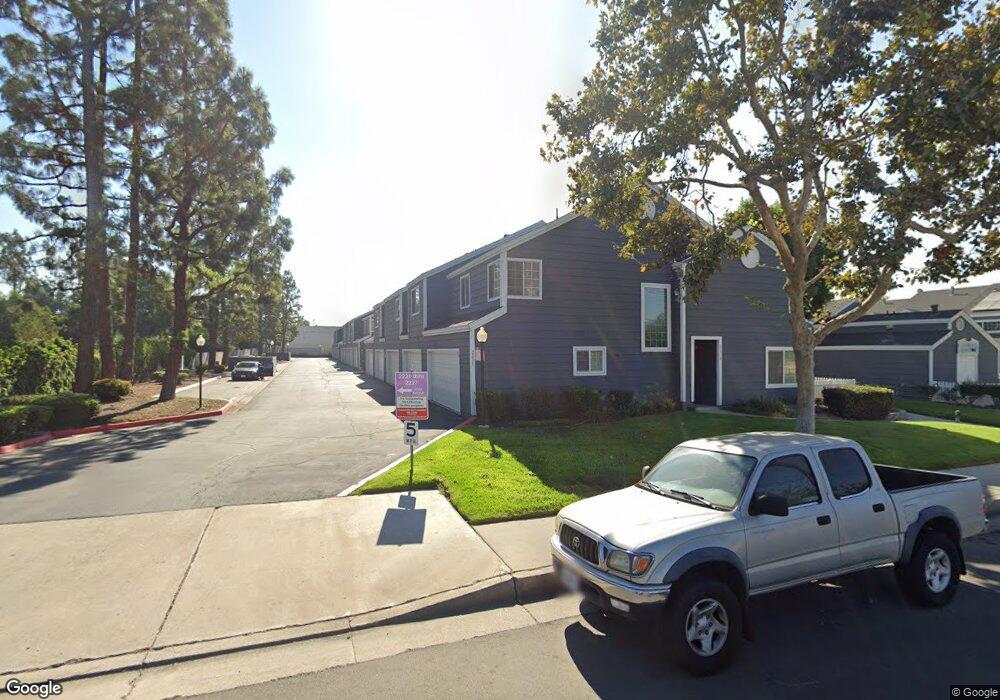
2231 S Fern Ave Unit B Ontario, CA 91762
Downtown Ontario NeighborhoodEstimated Value: $468,000 - $478,494
2
Beds
3
Baths
1,196
Sq Ft
$397/Sq Ft
Est. Value
About This Home
This home is located at 2231 S Fern Ave Unit B, Ontario, CA 91762 and is currently estimated at $475,124, approximately $397 per square foot. 2231 S Fern Ave Unit B is a home located in San Bernardino County with nearby schools including Richard Haynes Elementary, Oaks Middle, and Ontario High School.
Ownership History
Date
Name
Owned For
Owner Type
Purchase Details
Closed on
Jun 21, 1997
Sold by
Quiroz Caroline
Bought by
Quiroz Fernando
Current Estimated Value
Home Financials for this Owner
Home Financials are based on the most recent Mortgage that was taken out on this home.
Original Mortgage
$70,099
Outstanding Balance
$9,979
Interest Rate
7.92%
Mortgage Type
FHA
Estimated Equity
$465,145
Purchase Details
Closed on
Jun 9, 1997
Sold by
Hud
Bought by
Quiroz Terri and Quiroz Fernando
Home Financials for this Owner
Home Financials are based on the most recent Mortgage that was taken out on this home.
Original Mortgage
$70,099
Outstanding Balance
$9,979
Interest Rate
7.92%
Mortgage Type
FHA
Estimated Equity
$465,145
Purchase Details
Closed on
Mar 31, 1997
Sold by
Norwest Mtg Inc
Bought by
Hud
Purchase Details
Closed on
Feb 19, 1997
Sold by
Heyen John P and Andruska Sharyl L
Bought by
Norwest Mtg Inc
Purchase Details
Closed on
Sep 19, 1995
Sold by
Heyen John P
Bought by
Heyen John P and Andruska Sharyl L
Home Financials for this Owner
Home Financials are based on the most recent Mortgage that was taken out on this home.
Original Mortgage
$98,800
Interest Rate
7.97%
Mortgage Type
FHA
Create a Home Valuation Report for This Property
The Home Valuation Report is an in-depth analysis detailing your home's value as well as a comparison with similar homes in the area
Home Values in the Area
Average Home Value in this Area
Purchase History
| Date | Buyer | Sale Price | Title Company |
|---|---|---|---|
| Quiroz Fernando | -- | Continental Lawyers Title Co | |
| Quiroz Terri | $70,500 | Continental Lawyers Title Co | |
| Hud | -- | Fidelity National Title Ins | |
| Norwest Mtg Inc | $109,575 | Fidelity National Title Ins | |
| Heyen John P | -- | First American Title Ins |
Source: Public Records
Mortgage History
| Date | Status | Borrower | Loan Amount |
|---|---|---|---|
| Open | Quiroz Terri | $70,099 | |
| Previous Owner | Heyen John P | $98,800 |
Source: Public Records
Tax History Compared to Growth
Tax History
| Year | Tax Paid | Tax Assessment Tax Assessment Total Assessment is a certain percentage of the fair market value that is determined by local assessors to be the total taxable value of land and additions on the property. | Land | Improvement |
|---|---|---|---|---|
| 2025 | $1,226 | $111,775 | $28,744 | $83,031 |
| 2024 | $1,226 | $109,583 | $28,180 | $81,403 |
| 2023 | $1,192 | $107,434 | $27,627 | $79,807 |
| 2022 | $1,177 | $105,327 | $27,085 | $78,242 |
| 2021 | $1,169 | $103,262 | $26,554 | $76,708 |
| 2020 | $1,149 | $102,203 | $26,282 | $75,921 |
| 2019 | $1,139 | $100,199 | $25,767 | $74,432 |
| 2018 | $1,124 | $98,235 | $25,262 | $72,973 |
| 2017 | $1,084 | $96,309 | $24,767 | $71,542 |
| 2016 | $1,042 | $94,420 | $24,281 | $70,139 |
| 2015 | $1,035 | $93,001 | $23,916 | $69,085 |
| 2014 | $1,004 | $91,180 | $23,448 | $67,732 |
Source: Public Records
Map
Nearby Homes
- 2333 S Via Esplanade Unit 29
- 2333 S Via Esplanade Unit 25
- 2350 S Via Esplanade Unit 31
- 2343 S Via Veranda Unit 10
- 558 W Philadelphia St
- 1949 S Palm Place
- 6736 Aster Ct
- 310 E Philadelphia St Unit 35
- 310 E Philadelphia St
- 2022 S San Antonio Ave
- 12482 Silkleaf Ave
- 304 E Cedar St
- 6763 Poinsettia Ct
- 320 W Walnut St Unit 6
- 2148 S Sultana Ave
- 2300 S Sultana Ave Unit 298
- 12476 Park Ave
- 6703 Poinsettia Ct
- 1849 S San Antonio Ave
- 513 E Fairfield Ct
- 2231 S Fern Ave Unit 1
- 2231 S Fern Ave Unit E
- 2231 S Fern Ave Unit D
- 2231 S Fern Ave Unit C
- 2233 S Fern Ave
- 2233 S Fern Ave Unit E
- 2233 S Fern Ave Unit D
- 2233 S Fern Ave Unit C
- 2233 S Fern Ave Unit B
- 2247 S Fern Ave Unit 23
- 2247 S Fern Ave Unit E
- 2247 S Fern Ave
- 2247 S Fern Ave Unit C
- 2247 S Fern Ave Unit B
- 2259 S Fern Ave Unit 28
- 2259 S Fern Ave Unit E
- 2259 S Fern Ave Unit D
- 2259 S Fern Ave Unit C
- 2259 S Fern Ave Unit B