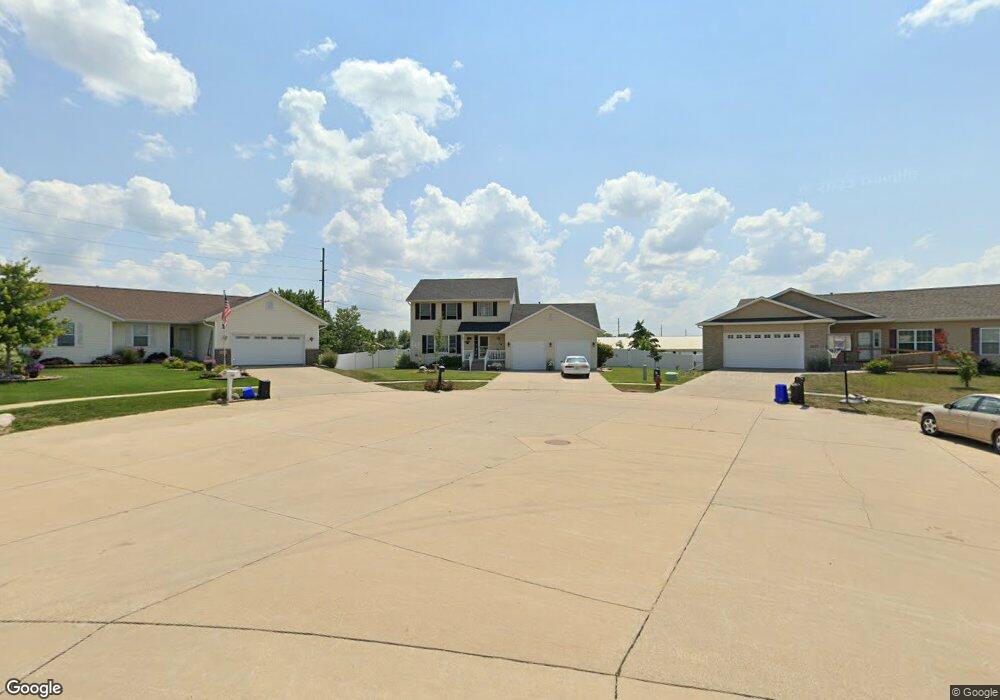
2231 Tamerac Cir Marion, IA 52302
Estimated Value: $334,000 - $360,000
3
Beds
4
Baths
2,473
Sq Ft
$139/Sq Ft
Est. Value
About This Home
This home is located at 2231 Tamerac Cir, Marion, IA 52302 and is currently estimated at $342,574, approximately $138 per square foot. 2231 Tamerac Cir is a home located in Linn County with nearby schools including Linn Grove Elementary School, Excelsior Middle School, and Linn-Mar High School.
Ownership History
Date
Name
Owned For
Owner Type
Purchase Details
Closed on
Oct 6, 2011
Sold by
Francois Matthew M and Francois Rachel J
Bought by
Foens Scott R and Foens Linda
Current Estimated Value
Home Financials for this Owner
Home Financials are based on the most recent Mortgage that was taken out on this home.
Original Mortgage
$152,800
Interest Rate
4.08%
Mortgage Type
New Conventional
Purchase Details
Closed on
May 7, 2004
Sold by
Prairie Hill Development Co
Bought by
Francois Matthew M and Francois Rachel J
Home Financials for this Owner
Home Financials are based on the most recent Mortgage that was taken out on this home.
Original Mortgage
$180,000
Interest Rate
5.63%
Mortgage Type
Construction
Create a Home Valuation Report for This Property
The Home Valuation Report is an in-depth analysis detailing your home's value as well as a comparison with similar homes in the area
Home Values in the Area
Average Home Value in this Area
Purchase History
| Date | Buyer | Sale Price | Title Company |
|---|---|---|---|
| Foens Scott R | $190,500 | None Available | |
| Francois Matthew M | $33,500 | -- |
Source: Public Records
Mortgage History
| Date | Status | Borrower | Loan Amount |
|---|---|---|---|
| Previous Owner | Foens Scott R | $152,800 | |
| Previous Owner | Francois Matthew M | $180,000 |
Source: Public Records
Tax History Compared to Growth
Tax History
| Year | Tax Paid | Tax Assessment Tax Assessment Total Assessment is a certain percentage of the fair market value that is determined by local assessors to be the total taxable value of land and additions on the property. | Land | Improvement |
|---|---|---|---|---|
| 2025 | $5,538 | $280,500 | $44,800 | $235,700 |
| 2024 | $5,294 | $313,600 | $44,800 | $268,800 |
| 2023 | $5,294 | $313,600 | $44,800 | $268,800 |
| 2022 | $5,042 | $250,800 | $44,800 | $206,000 |
| 2021 | $4,726 | $250,800 | $44,800 | $206,000 |
| 2020 | $4,726 | $221,600 | $44,800 | $176,800 |
| 2019 | $4,596 | $215,500 | $50,400 | $165,100 |
| 2018 | $4,412 | $215,500 | $50,400 | $165,100 |
| 2017 | $4,454 | $212,300 | $50,400 | $161,900 |
| 2016 | $4,224 | $199,100 | $37,200 | $161,900 |
| 2015 | $3,909 | $185,100 | $37,200 | $147,900 |
| 2014 | $3,722 | $185,100 | $37,200 | $147,900 |
| 2013 | $3,548 | $185,100 | $37,200 | $147,900 |
Source: Public Records
Map
Nearby Homes
- 5865 Robinwood Ln
- Caldwell Plan at Prairie Ridge Estates
- Copeland Plan at Prairie Ridge Estates
- Concord - Cedar Rapids Plan at Prairie Ridge Estates
- Yuma Expanded - Cedar Rapids Plan at Prairie Ridge Estates
- Yuma Expanded Plan at Prairie Ridge Estates
- Meadowbrook - Cedar Rapids Plan at Prairie Ridge Estates
- Becker II - Cedar Rapids Plan at Prairie Ridge Estates
- Remington - Cedar Rapids Plan at Prairie Ridge Estates
- Becker - Cedar Rapids Plan at Prairie Ridge Estates
- 2239 Crestwood Ln
- 0 Robinwood Ln
- 6166 Cope Dr
- 6279 Glenwood Dr
- 6177 Glenwood Dr
- 6188 Cope Dr
- 2200 50th St
- 2403 49th Street Ct
- 2734 Rookwood Ln
- 2700 Rookwood Ln
- 2247 Tamerac Cir
- 2217 Tamerac Cir
- 2261 Tamerac Cir
- 5680 Kacena Ave
- 2185 Prairie Hill Dr
- 2277 Tamerac Cir
- 2230 Tamerac Cir
- 2270 Tamerac Cir
- 5650 Kacena Ave
- 2215 Prairie Hill Dr
- 2291 Tamerac Cir
- 2290 Tamerac Cir
- 2245 Prairie Hill Dr
- 5580 21st Ave
- 2200 Tamerac Dr
- 2307 Tamerac Cir
- 5585 21st Ave
- 2275 Prairie Hill Dr
- 5550 21st Ave
- 2210 Prairie Hill Dr