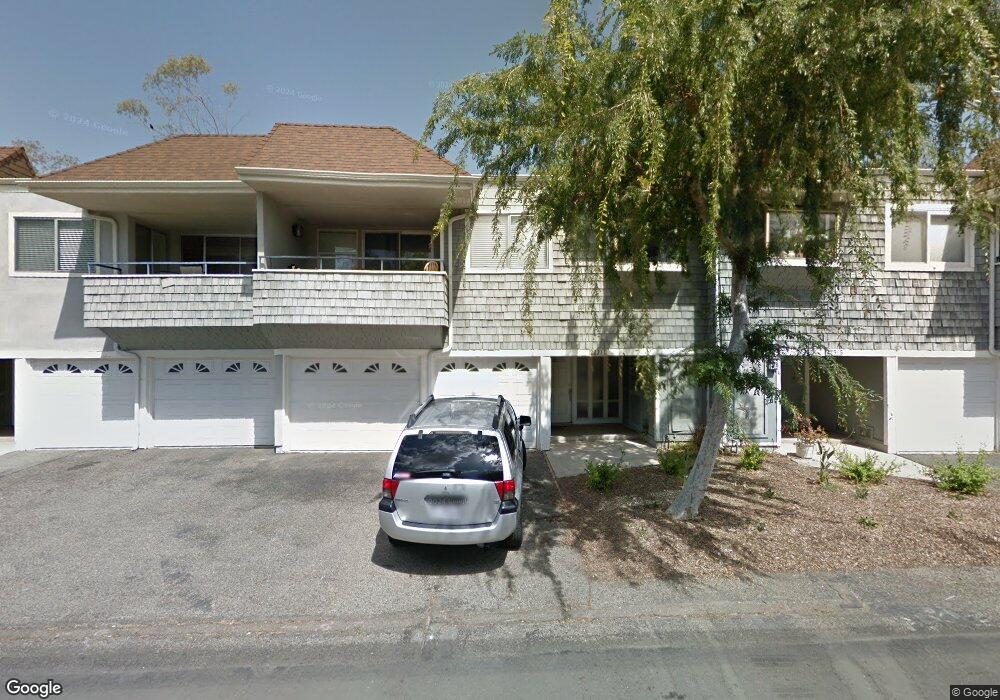
22311 Caminito Tecate Unit 292 Laguna Hills, CA 92653
North Laguna Hills NeighborhoodEstimated Value: $692,000 - $731,000
3
Beds
2
Baths
1,400
Sq Ft
$504/Sq Ft
Est. Value
About This Home
This home is located at 22311 Caminito Tecate Unit 292, Laguna Hills, CA 92653 and is currently estimated at $705,450, approximately $503 per square foot. 22311 Caminito Tecate Unit 292 is a home located in Orange County with nearby schools including San Joaquin Elementary School, Los Alisos Intermediate School, and Laguna Hills High.
Ownership History
Date
Name
Owned For
Owner Type
Purchase Details
Closed on
Oct 9, 2025
Sold by
Jacobsen Robert and Jacobsen Mindy W
Bought by
Robert And Mindy Jacobsen Living Trust and Jacobsen
Current Estimated Value
Purchase Details
Closed on
Feb 15, 2005
Sold by
Jacobsen Robert and Jacobsen Mindy W
Bought by
Jacobsen Robert and Jacobsen Mindy W
Home Financials for this Owner
Home Financials are based on the most recent Mortgage that was taken out on this home.
Original Mortgage
$326,000
Interest Rate
5.79%
Mortgage Type
New Conventional
Purchase Details
Closed on
May 7, 2003
Sold by
Kishel Gregory F and Kishel Patricia G
Bought by
Jacobsen Robert W and Dymond Mindy
Home Financials for this Owner
Home Financials are based on the most recent Mortgage that was taken out on this home.
Original Mortgage
$222,000
Interest Rate
5.71%
Mortgage Type
Purchase Money Mortgage
Create a Home Valuation Report for This Property
The Home Valuation Report is an in-depth analysis detailing your home's value as well as a comparison with similar homes in the area
Home Values in the Area
Average Home Value in this Area
Purchase History
| Date | Buyer | Sale Price | Title Company |
|---|---|---|---|
| Robert And Mindy Jacobsen Living Trust | -- | None Listed On Document | |
| Jacobsen Robert | -- | Chicago Title Co | |
| Jacobsen Robert W | $277,500 | United Title |
Source: Public Records
Mortgage History
| Date | Status | Borrower | Loan Amount |
|---|---|---|---|
| Previous Owner | Jacobsen Robert | $326,000 | |
| Previous Owner | Jacobsen Robert W | $222,000 |
Source: Public Records
Tax History Compared to Growth
Tax History
| Year | Tax Paid | Tax Assessment Tax Assessment Total Assessment is a certain percentage of the fair market value that is determined by local assessors to be the total taxable value of land and additions on the property. | Land | Improvement |
|---|---|---|---|---|
| 2025 | $4,067 | $401,900 | $250,451 | $151,449 |
| 2024 | $4,067 | $394,020 | $245,540 | $148,480 |
| 2023 | $3,971 | $386,295 | $240,726 | $145,569 |
| 2022 | $3,901 | $378,721 | $236,006 | $142,715 |
| 2021 | $3,823 | $371,296 | $231,379 | $139,917 |
| 2020 | $3,789 | $367,489 | $229,006 | $138,483 |
| 2019 | $3,714 | $360,284 | $224,516 | $135,768 |
| 2018 | $3,644 | $353,220 | $220,114 | $133,106 |
| 2017 | $3,572 | $346,295 | $215,798 | $130,497 |
| 2016 | $3,513 | $339,505 | $211,566 | $127,939 |
| 2015 | $3,471 | $334,406 | $208,388 | $126,018 |
| 2014 | $3,092 | $298,450 | $183,143 | $115,307 |
Source: Public Records
Map
Nearby Homes
- 22306 Caminito Danubo
- 22321 Caminito Mescalero Unit 226
- 23271 Caminito Andreta Unit 63
- 23372 Caminito Marcial Unit 187
- 22461 Caminito Costa Unit 20
- 23371 Caminito Telmo Unit 180
- 22185 Caminito Vino
- 23372 Caminito Telmo Unit 210
- 23446 Caminito Salado
- 23332 Caminito Lazaro Unit 260
- 23392 Caminito Basilio Unit 332
- 22552 Montova
- 23601 Marsala
- 22561 Catania
- 5309 Cantante
- 3128 Via Serena N Unit N
- 3130 Via Serena N Unit C
- 5149 Miembro
- 3121 Via Serena N Unit D
- 3088 Via Serena N Unit D
- 22305 Caminito Tecate Unit 291
- 22315 Caminito Tecate
- 22321 Caminito Tecate
- 22331 Caminito Tecate
- 22306 Caminito Tecate Unit 324
- 22306 Caminito Tecate
- 22312 Caminito Tecate Unit 323
- 22316 Caminito Tecate
- 22335 Caminito Tecate
- 22326 Caminito Tecate Unit 321
- 22275 Caminito Tecate Unit 261
- 22341 Caminito Tecate Unit 297
- 22271 Caminito Tecate
- 22312 Caminito Danubo Unit 284
- 22316 Caminito Danubo Unit 285
- 22316 Caminito Danubo
- 22282 Caminito Tecate Unit 263
- 22302 Caminito Danubo Unit 282
- 22326 Caminito Danubo Unit 286
- 22326 Caminito Danubo