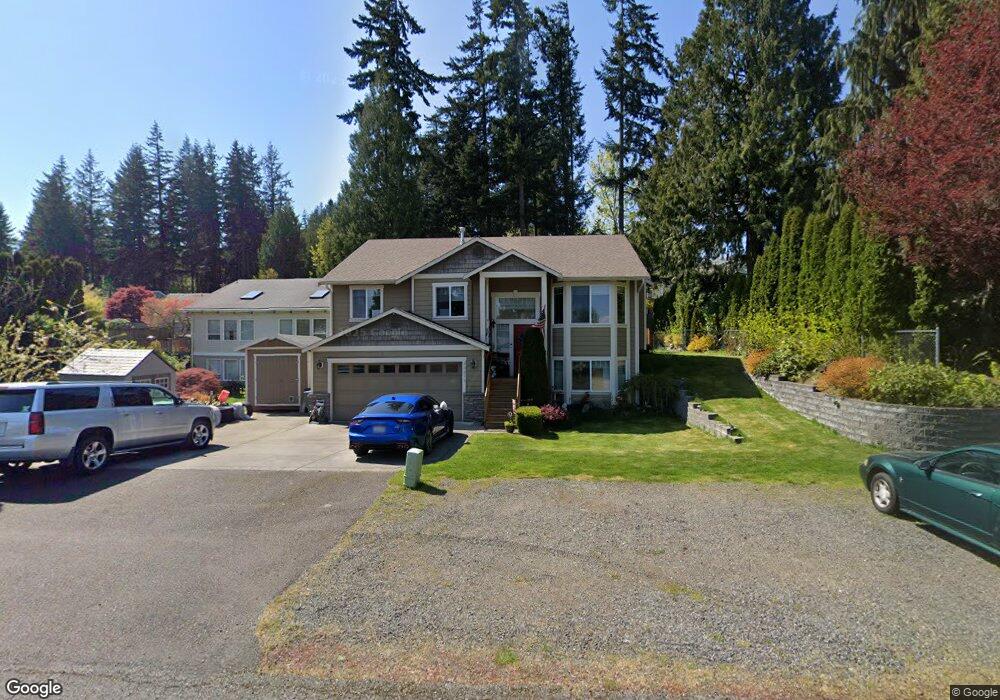
22318 3rd Ave SE Bothell, WA 98021
Queensborough-Brentwood NeighborhoodEstimated Value: $1,014,000 - $1,090,000
5
Beds
3
Baths
2,178
Sq Ft
$490/Sq Ft
Est. Value
About This Home
This home is located at 22318 3rd Ave SE, Bothell, WA 98021 and is currently estimated at $1,066,789, approximately $489 per square foot. 22318 3rd Ave SE is a home located in Snohomish County with nearby schools including Shelton View Elementary School, Canyon Park Junior High School, and Bothell High School.
Ownership History
Date
Name
Owned For
Owner Type
Purchase Details
Closed on
Apr 26, 2010
Sold by
3732 Ii Llc
Bought by
Crooks Todd and Crooks Jeanette
Current Estimated Value
Home Financials for this Owner
Home Financials are based on the most recent Mortgage that was taken out on this home.
Original Mortgage
$376,057
Outstanding Balance
$244,544
Interest Rate
4.92%
Mortgage Type
VA
Estimated Equity
$822,245
Purchase Details
Closed on
Aug 28, 2009
Sold by
Mountain Pacific Bank
Bought by
3732 Ii Llc
Purchase Details
Closed on
Apr 15, 2009
Sold by
Dream Construction Inc
Bought by
Mountain Pacific Bank
Purchase Details
Closed on
Nov 14, 2006
Sold by
Roberts Dale and Roberts Susie
Bought by
Dream Construction Inc
Home Financials for this Owner
Home Financials are based on the most recent Mortgage that was taken out on this home.
Original Mortgage
$440,000
Interest Rate
6.37%
Mortgage Type
Construction
Create a Home Valuation Report for This Property
The Home Valuation Report is an in-depth analysis detailing your home's value as well as a comparison with similar homes in the area
Home Values in the Area
Average Home Value in this Area
Purchase History
| Date | Buyer | Sale Price | Title Company |
|---|---|---|---|
| Crooks Todd | $390,000 | Chicago Title | |
| 3732 Ii Llc | -- | None Available | |
| Mountain Pacific Bank | $28,089 | Chicago Title | |
| Dream Construction Inc | $248,000 | Chicago Title |
Source: Public Records
Mortgage History
| Date | Status | Borrower | Loan Amount |
|---|---|---|---|
| Open | Crooks Todd | $376,057 | |
| Previous Owner | Dream Construction Inc | $440,000 |
Source: Public Records
Tax History
| Year | Tax Paid | Tax Assessment Tax Assessment Total Assessment is a certain percentage of the fair market value that is determined by local assessors to be the total taxable value of land and additions on the property. | Land | Improvement |
|---|---|---|---|---|
| 2026 | $8,197 | $1,037,700 | $570,000 | $467,700 |
| 2025 | $7,553 | $974,900 | $525,000 | $449,900 |
| 2024 | $7,553 | $894,700 | $460,000 | $434,700 |
| 2023 | $8,605 | $1,117,400 | $670,000 | $447,400 |
| 2022 | $7,916 | $829,700 | $451,000 | $378,700 |
| 2020 | $6,380 | $617,500 | $305,000 | $312,500 |
| 2019 | $5,695 | $570,600 | $270,000 | $300,600 |
| 2018 | $5,224 | $503,900 | $235,000 | $268,900 |
| 2017 | $4,694 | $458,000 | $188,000 | $270,000 |
| 2016 | $4,205 | $423,000 | $164,000 | $259,000 |
| 2015 | $4,060 | $386,800 | $154,000 | $232,800 |
| 2013 | $3,716 | $311,400 | $118,000 | $193,400 |
Source: Public Records
Map
Nearby Homes
- 19924 7th Dr SE
- 20021 7th Dr SE
- 20027 7th Dr SE
- 100 228th St SE Unit 19B
- 104 219th Place SE
- 22621 8th Dr SE
- 22827 Meridian Ave S
- 224 224th St SW
- 917 228th St SE
- 23022 7th Ave SE
- 22619 4th Ave W Unit 3-103
- 21707 2nd Ave SE
- 22426 3rd Place W
- 21713 Meridian Ave S
- 29 232nd Place SW
- 404 228th St SW Unit E101
- 18 232nd Place SW
- 600 228th St SW Unit I101
- 601 220th St SW
- 814 213th St SE
- 227 224th St SE
- 22310 3rd Ave SE
- 22302 3rd Ave SE
- 22308 2nd Place SE
- 22326 2nd Place SE
- 22321 3rd Ave SE
- 22315 3rd Ave SE
- 22314 2nd Place SE
- 22329 3rd Ave SE
- 22307 3rd Ave SE
- 22410 3rd Ave SE
- 228 224th St SE
- 22125 1st Dr SE
- 21623 1st Dr SE
- 22231 3rd Ave SE
- 22131 1st Dr SE
- 22224 3rd Ave SE
- 315 224th St SE
- 222 224th St SE
Your Personal Tour Guide
Ask me questions while you tour the home.