
Seller's Agent in 2025
Christie Duggar
Group Harmony
(970) 229-0700
1 in this area
163 Total Sales
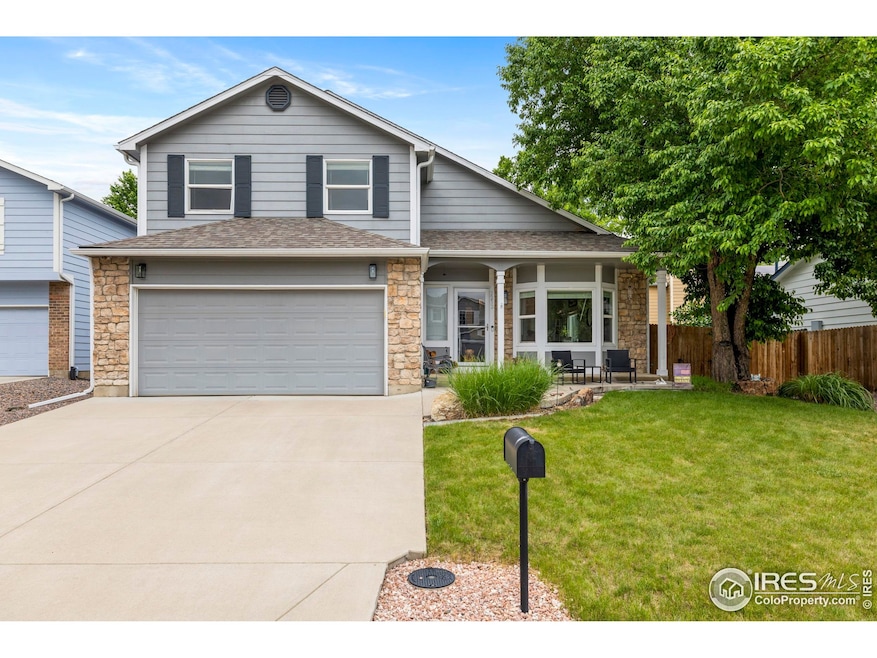
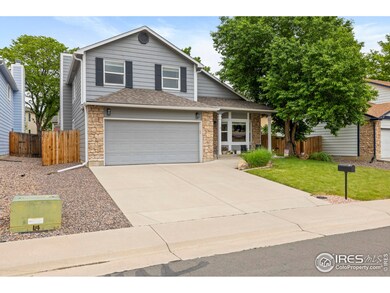
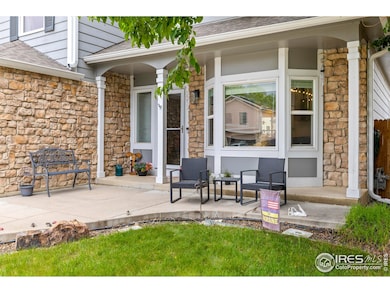
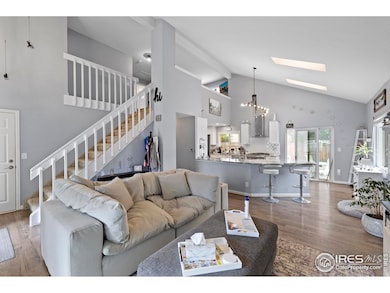
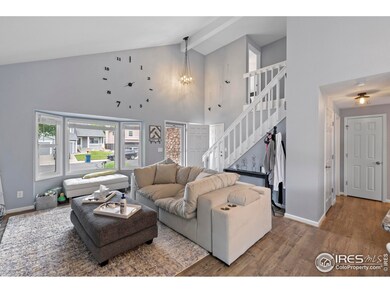
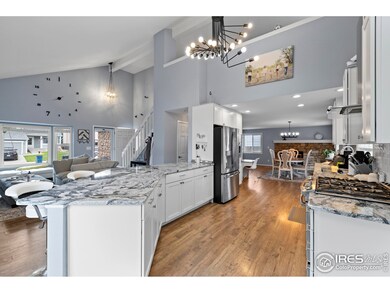
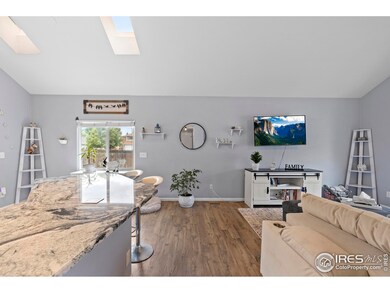
Step into comfort and style with this beautifully updated home! From the moment you arrive, the charming front porch invites you to sit back, relax, and enjoy the neighborhood. Step inside to find stylish vinyl plank flooring throughout the main level and tons of natural light pouring in through large windows-giving the whole space a warm, inviting feel. The kitchen is a true highlight, featuring updated cabinets, sleek granite countertops, and stainless steel appliances-including a gas range for those who love to cook. The open-concept living room has vaulted ceilings and a cozy stone-surround fireplace, making it the perfect spot to unwind. Upstairs, you'll love the bright loft area that overlooks the living room-perfect for a home office, reading nook, or play area. The spacious primary bedroom also has vaulted ceilings and an upgraded en-suite bathroom with a gorgeous glass shower enclosure. Looking for even more space? The finished basement, complete with brand-new carpet, offers flexibility for a guest suite, gym, or media room. Out back, you'll find an extended concrete patio that's ready for summer BBQs and a handy shed for extra storage. This home has been thoughtfully updated and is ready for you to move in and make it your own. Come take a look-you'll feel right at home the moment you walk in!
| Date | Type | Sale Price | Title Company |
|---|---|---|---|
| Warranty Deed | $540,000 | None Listed On Document | |
| Interfamily Deed Transfer | -- | None Available | |
| Warranty Deed | $199,950 | -- | |
| Deed | -- | -- | |
| Deed | -- | -- |
| Date | Status | Loan Amount | Loan Type |
|---|---|---|---|
| Open | $486,000 | New Conventional | |
| Previous Owner | $197,164 | FHA |
| Date | Event | Price | List to Sale | Price per Sq Ft |
|---|---|---|---|---|
| 07/21/2025 07/21/25 | Sold | $540,000 | +0.9% | $226 / Sq Ft |
| 06/10/2025 06/10/25 | For Sale | $535,000 | -- | $224 / Sq Ft |
| Year | Tax Paid | Tax Assessment Tax Assessment Total Assessment is a certain percentage of the fair market value that is determined by local assessors to be the total taxable value of land and additions on the property. | Land | Improvement |
|---|---|---|---|---|
| 2024 | $2,963 | $31,879 | -- | -- |
| 2023 | $2,963 | $31,879 | $0 | $0 |
| 2022 | $2,665 | $26,542 | $0 | $0 |
| 2021 | $2,751 | $26,542 | $0 | $0 |
| 2020 | $2,599 | $24,960 | $0 | $0 |
| 2019 | $2,585 | $24,960 | $0 | $0 |
| 2018 | $2,225 | $21,038 | $0 | $0 |
| 2017 | $1,935 | $21,038 | $0 | $0 |
| 2016 | $1,663 | $17,703 | $0 | $0 |
| 2015 | $1,605 | $17,703 | $0 | $0 |
| 2014 | $1,240 | $13,166 | $0 | $0 |
| 2013 | -- | $16,070 | $0 | $0 |
Seller's Agent in 2025
Christie Duggar
Group Harmony
(970) 229-0700
1 in this area
163 Total Sales
T
Seller Co-Listing Agent in 2025
The Duggar Team
Group Harmony
(970) 286-8122
1 in this area
91 Total Sales
Buyer's Agent in 2025
Amanda Fein
(720) 935-5759
1 in this area
86 Total Sales
Source: IRES MLS
MLS Number: 1036384
APN: 1975-28-1-18-014
Disclaimer: Certain information contained herein is derived from information provided by parties other than Homes.com. All information provided is deemed reliable, but is not guaranteed to be accurate and should be independently verified.
![]() Information source: Information and Real Estate Services, LLC. Provided for limited non-commercial use only under IRES Rules © Copyright IRES.
Information source: Information and Real Estate Services, LLC. Provided for limited non-commercial use only under IRES Rules © Copyright IRES.
Listing information is provided exclusively for consumers' personal, non-commercial use and may not be used for any purpose other than to identify prospective properties consumers may be interested in purchasing.
Information deemed reliable but not guaranteed by the MLS.