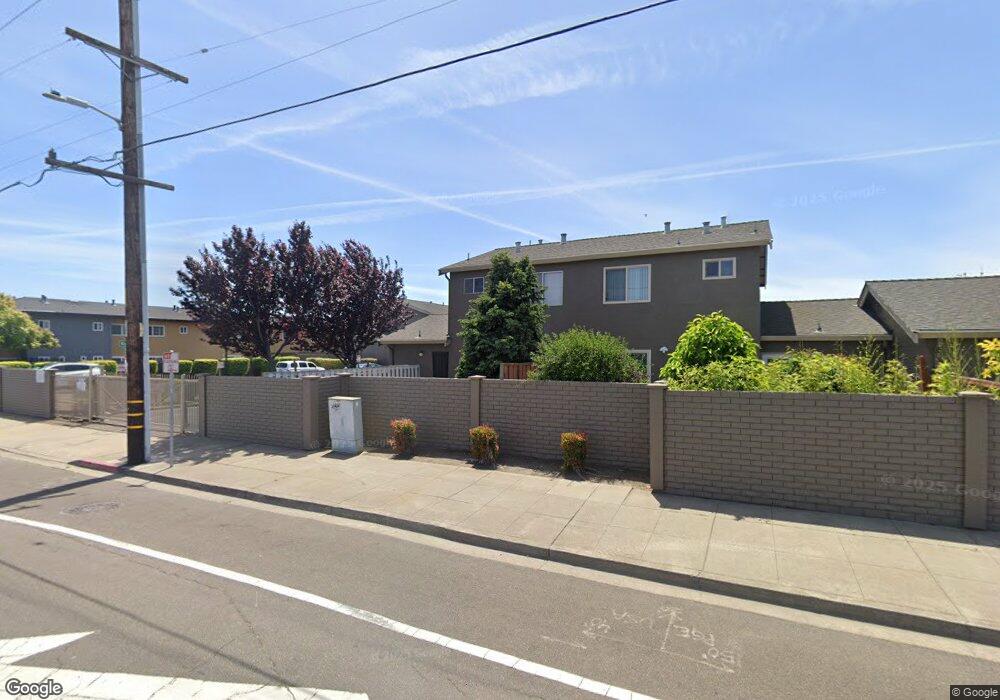
2232 Windlass Way San Leandro, CA 94577
Marina Faire NeighborhoodEstimated Value: $448,000 - $642,000
2
Beds
2
Baths
1,062
Sq Ft
$527/Sq Ft
Est. Value
About This Home
This home is located at 2232 Windlass Way, San Leandro, CA 94577 and is currently estimated at $559,846, approximately $527 per square foot. 2232 Windlass Way is a home located in Alameda County with nearby schools including Garfield Elementary School, John Muir Middle School, and San Leandro High School.
Ownership History
Date
Name
Owned For
Owner Type
Purchase Details
Closed on
Oct 27, 2022
Sold by
Smid Wandee R
Bought by
Wandee Smid Trust
Current Estimated Value
Purchase Details
Closed on
Feb 20, 2018
Sold by
Smid Wandee R and Smid Wandee
Bought by
Smid Wandee and Maldonado Alejandro
Home Financials for this Owner
Home Financials are based on the most recent Mortgage that was taken out on this home.
Original Mortgage
$300,000
Interest Rate
3.99%
Mortgage Type
New Conventional
Purchase Details
Closed on
Oct 8, 2002
Sold by
Burdick Stokstad Paul Allan and Burdick Stokstad Shelley
Bought by
Smid Wandee R
Home Financials for this Owner
Home Financials are based on the most recent Mortgage that was taken out on this home.
Original Mortgage
$203,000
Interest Rate
5.75%
Purchase Details
Closed on
Sep 2, 1999
Sold by
Stokstad Paul A
Bought by
Burdick Stokstad Paul Allan and Burdick Stokstad Shelley
Create a Home Valuation Report for This Property
The Home Valuation Report is an in-depth analysis detailing your home's value as well as a comparison with similar homes in the area
Home Values in the Area
Average Home Value in this Area
Purchase History
| Date | Buyer | Sale Price | Title Company |
|---|---|---|---|
| Wandee Smid Trust | -- | -- | |
| Smid Wandee | -- | Servicelink | |
| Smid Wandee R | $254,000 | Commonwealth Land Title Co | |
| Burdick Stokstad Paul Allan | -- | -- |
Source: Public Records
Mortgage History
| Date | Status | Borrower | Loan Amount |
|---|---|---|---|
| Previous Owner | Smid Wandee | $300,000 | |
| Previous Owner | Smid Wandee R | $203,000 | |
| Closed | Smid Wandee R | $50,750 |
Source: Public Records
Tax History Compared to Growth
Tax History
| Year | Tax Paid | Tax Assessment Tax Assessment Total Assessment is a certain percentage of the fair market value that is determined by local assessors to be the total taxable value of land and additions on the property. | Land | Improvement |
|---|---|---|---|---|
| 2025 | $2,221 | $104,457 | $110,352 | $257,055 |
| 2024 | $2,221 | $105,549 | $108,189 | $252,016 |
| 2023 | $3,263 | $192,061 | $106,068 | $247,076 |
| 2022 | $3,272 | $196,228 | $103,989 | $242,232 |
| 2021 | $3,136 | $191,900 | $101,951 | $237,484 |
| 2020 | $3,063 | $335,956 | $100,906 | $235,050 |
| 2019 | $2,994 | $329,370 | $98,928 | $230,442 |
| 2018 | $2,921 | $322,913 | $96,988 | $225,925 |
| 2017 | $4,386 | $316,583 | $95,087 | $221,496 |
| 2016 | $4,163 | $310,378 | $93,223 | $217,155 |
| 2015 | $4,090 | $305,718 | $91,824 | $213,894 |
| 2014 | $3,590 | $260,000 | $78,000 | $182,000 |
Source: Public Records
Map
Nearby Homes
- 2246 Windlass Way
- 2127 Fairway Dr
- 14075 Doolittle Dr
- 2459 Jamaica Way
- 2350 W Avenue 135th
- 2474 Fairway Dr
- 2140 W Avenue 134th
- 14161 Seagate Dr Unit 228
- 14544 Tiburon Rd
- 14587 Doolittle Dr
- 14408 Outrigger Dr
- 14617 Doolittle Dr
- 2515 Galleon Place Unit 129
- 2090 Marina Blvd
- 2078 Fairbanks St
- 1993 Juneau St
- 1947 Nome St
- 2258 Sitka St
- 1803 Cedar Ave
- 14700 Acacia St
- 2228 Windlass Way
- 2236 Windlass Way
- 2220 Windlass Way
- 2240 Windlass Way
- 2214 Windlass Way
- 13769 Jib Rd
- 2242 Windlass Way
- 2237 Windlass Way
- 2241 Windlass Way
- 13755 Jib Rd
- 2229 Windlass Way
- 2233 Windlass Way
- 13743 Jib Rd
- 13768 Jib Rd
- 2200 Doolittle Dr
- 13754 Jib Rd
- 13738 Schooner Rd
- 13737 Jib Rd
- 13742 Jib Rd
- 2230 Transom Way