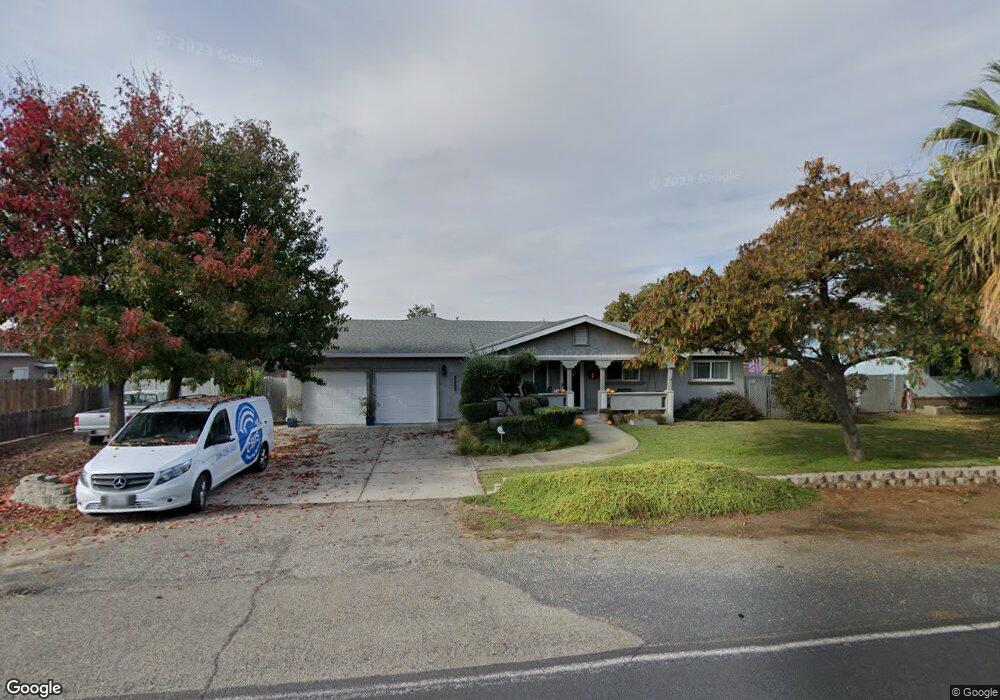
22323 Oleander Rd Manteca, CA 95337
Estimated Value: $547,000 - $704,000
3
Beds
3
Baths
2,250
Sq Ft
$284/Sq Ft
Est. Value
About This Home
This home is located at 22323 Oleander Rd, Manteca, CA 95337 and is currently estimated at $638,020, approximately $283 per square foot. 22323 Oleander Rd is a home located in San Joaquin County with nearby schools including Nile Garden Elementary School and Sierra High School.
Ownership History
Date
Name
Owned For
Owner Type
Purchase Details
Closed on
Nov 3, 2016
Sold by
Fogg Kenneth W and Fogg Heather A
Bought by
Fogg Ken and Fogg Heather
Current Estimated Value
Home Financials for this Owner
Home Financials are based on the most recent Mortgage that was taken out on this home.
Original Mortgage
$345,000
Outstanding Balance
$276,975
Interest Rate
3.42%
Mortgage Type
New Conventional
Estimated Equity
$361,045
Purchase Details
Closed on
Nov 20, 2002
Sold by
Fogg Kenneth Wayne and Fogg Heather Anne
Bought by
Fogg Kenneth W and Fogg Heather A
Home Financials for this Owner
Home Financials are based on the most recent Mortgage that was taken out on this home.
Original Mortgage
$270,000
Interest Rate
6.12%
Purchase Details
Closed on
Apr 9, 2001
Sold by
Hutz Theodore B and Hutz Mary R
Bought by
Fogg Kenneth Wayne and Fogg Heather Anne
Home Financials for this Owner
Home Financials are based on the most recent Mortgage that was taken out on this home.
Original Mortgage
$171,000
Interest Rate
7.09%
Create a Home Valuation Report for This Property
The Home Valuation Report is an in-depth analysis detailing your home's value as well as a comparison with similar homes in the area
Home Values in the Area
Average Home Value in this Area
Purchase History
| Date | Buyer | Sale Price | Title Company |
|---|---|---|---|
| Fogg Ken | -- | First American Title Company | |
| Fogg Kenneth W | -- | Alliance Title Co | |
| Fogg Kenneth Wayne | $180,000 | Alliance Title Company |
Source: Public Records
Mortgage History
| Date | Status | Borrower | Loan Amount |
|---|---|---|---|
| Open | Fogg Ken | $345,000 | |
| Closed | Fogg Kenneth W | $270,000 | |
| Closed | Fogg Kenneth Wayne | $171,000 |
Source: Public Records
Tax History Compared to Growth
Tax History
| Year | Tax Paid | Tax Assessment Tax Assessment Total Assessment is a certain percentage of the fair market value that is determined by local assessors to be the total taxable value of land and additions on the property. | Land | Improvement |
|---|---|---|---|---|
| 2025 | $4,531 | $403,623 | $120,537 | $283,086 |
| 2024 | $4,406 | $395,710 | $118,174 | $277,536 |
| 2023 | $4,348 | $387,952 | $115,857 | $272,095 |
| 2022 | $4,288 | $380,346 | $113,586 | $266,760 |
| 2021 | $4,241 | $372,889 | $111,359 | $261,530 |
| 2020 | $4,073 | $369,067 | $110,218 | $258,849 |
| 2019 | $4,020 | $361,831 | $108,057 | $253,774 |
| 2018 | $3,966 | $354,738 | $105,939 | $248,799 |
| 2017 | $3,909 | $347,783 | $103,862 | $243,921 |
| 2016 | $3,816 | $340,966 | $101,826 | $239,140 |
| 2014 | $2,826 | $261,000 | $78,000 | $183,000 |
Source: Public Records
Map
Nearby Homes
- 2178 Al Fonseca Ln
- 2038 Wawona St
- 20109 S Union Rd
- 1090 Lavender St
- 1232 Nabih Hamdan Ct
- 1016 Lavender St
- 1204 Nabih Hamdan Ct
- The Toscana Plan at Griffin Park - Solera
- The Andalusia Plan at Griffin Park - Solera
- The Patagonia Plan at Griffin Park - Solera
- The Provence Plan at Griffin Park - Solera
- The Mendocino Plan at Griffin Park - Solera
- The Castile Plan at Griffin Park - Carriage Collection
- The Chateau Plan at Griffin Park - Carriage Collection
- The Chalet Plan at Griffin Park - Carriage Collection
- The Cottage Plan at Griffin Park - Carriage Collection
- 2522 Amur Ave
- 372 Whitefish St
- 370 Whitefish St
- 364 Whitefish St
- 22295 Oleander Rd
- 22367 Oleander Rd
- 22367 Oleander Ave
- 5161 Nile Rd
- 5261 Nile Rd
- 5180 Nile Rd
- 5131 Nile Rd
- 22263 Oleander Ave
- 5158 Nile Rd
- 22902 Oleander Ave
- 22902 Oleander Ave
- 5089 Nile Rd
- 22501 Oleander Ave
- 22221 Oleander Rd
- 5009 Nile Rd
- 22137 Oleander Ave
- 5200 Nile Rd
- 4988 Nile Rd
- 5575 Nile Rd
- 22079 Oleander Ave