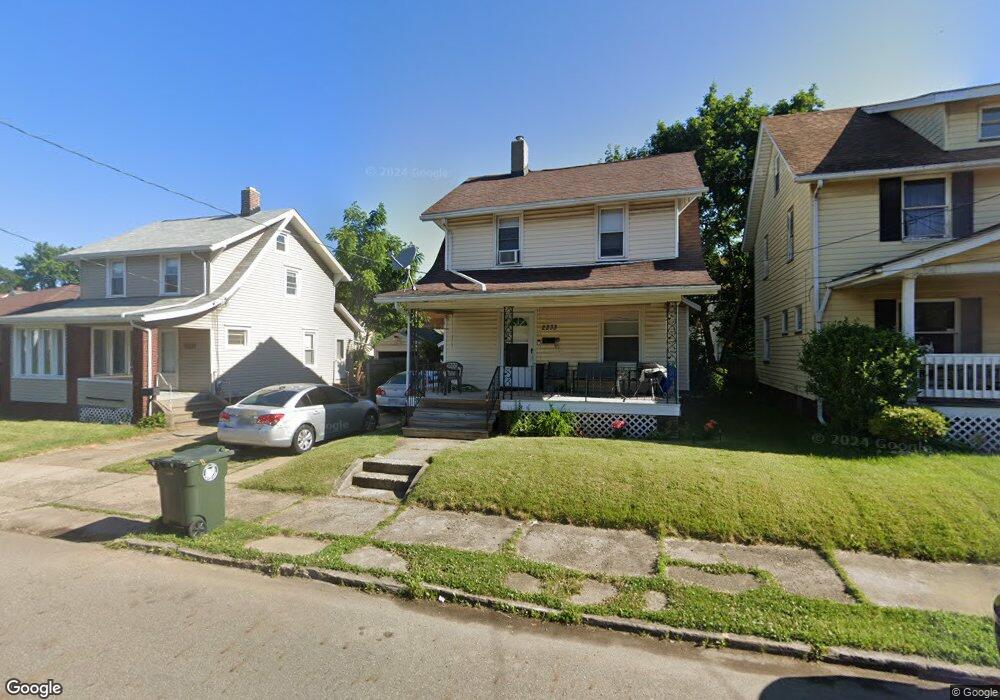
2233 7th St NW Canton, OH 44708
Estimated Value: $66,000 - $87,000
2
Beds
1
Bath
1,015
Sq Ft
$76/Sq Ft
Est. Value
About This Home
This home is located at 2233 7th St NW, Canton, OH 44708 and is currently estimated at $76,939, approximately $75 per square foot. 2233 7th St NW is a home located in Stark County with nearby schools including Harter Elementary School, Early Learning Center @ Schreiber, and Clarendon Intermediate School.
Ownership History
Date
Name
Owned For
Owner Type
Purchase Details
Closed on
Feb 12, 2016
Sold by
Wernecke Properties Ii Llc
Bought by
Wernecke Douglas J and Wernecke Carole R
Current Estimated Value
Purchase Details
Closed on
Apr 6, 2005
Sold by
Wernecke Douglas James and Wernecke Carole R
Bought by
Wernecke Properties Ii Llc
Purchase Details
Closed on
Apr 22, 2004
Sold by
Wells Fargo
Bought by
Wernecke Douglas and Wernecke Carole
Purchase Details
Closed on
Jan 29, 2004
Sold by
Kinnick Guy
Bought by
Wells Fargo and Wachovia Loan Trust 1998-2
Purchase Details
Closed on
Nov 1, 1999
Sold by
Kinnick Guy F
Bought by
Gower Durwood and Gower Kathy
Home Financials for this Owner
Home Financials are based on the most recent Mortgage that was taken out on this home.
Original Mortgage
$34,696
Interest Rate
6.92%
Mortgage Type
Seller Take Back
Create a Home Valuation Report for This Property
The Home Valuation Report is an in-depth analysis detailing your home's value as well as a comparison with similar homes in the area
Home Values in the Area
Average Home Value in this Area
Purchase History
| Date | Buyer | Sale Price | Title Company |
|---|---|---|---|
| Wernecke Douglas J | -- | None Available | |
| Wernecke Properties Ii Llc | -- | None Available | |
| Wernecke Properties Ii Llc | -- | -- | |
| Wernecke Douglas | $25,000 | Chicago Title Ins Co | |
| Wells Fargo | $28,000 | -- | |
| Gower Durwood | $34,696 | -- |
Source: Public Records
Mortgage History
| Date | Status | Borrower | Loan Amount |
|---|---|---|---|
| Previous Owner | Gower Durwood | $34,696 |
Source: Public Records
Tax History Compared to Growth
Tax History
| Year | Tax Paid | Tax Assessment Tax Assessment Total Assessment is a certain percentage of the fair market value that is determined by local assessors to be the total taxable value of land and additions on the property. | Land | Improvement |
|---|---|---|---|---|
| 2025 | -- | $19,080 | $3,710 | $15,370 |
| 2024 | -- | $19,080 | $3,710 | $15,370 |
| 2023 | $729 | $11,940 | $2,630 | $9,310 |
| 2022 | $712 | $11,940 | $2,630 | $9,310 |
| 2021 | $719 | $11,940 | $2,630 | $9,310 |
| 2020 | $597 | $8,860 | $2,070 | $6,790 |
| 2019 | $517 | $8,870 | $2,070 | $6,800 |
| 2018 | $527 | $8,870 | $2,070 | $6,800 |
| 2017 | $583 | $8,930 | $2,210 | $6,720 |
| 2016 | $585 | $8,930 | $2,210 | $6,720 |
| 2015 | $202 | $8,930 | $2,210 | $6,720 |
| 2014 | $665 | $9,500 | $2,350 | $7,150 |
| 2013 | $322 | $9,500 | $2,350 | $7,150 |
Source: Public Records
Map
Nearby Homes
- 2425 7th St NW
- 807 Bedford Ave NW
- 521 Columbus Ave NW
- 834 Clarendon Ave NW
- 354 Clarendon Ave NW
- 2616 Crown Place NW
- 607 Rosemont Ct NW
- 304 Columbus Ave NW
- 811 Broad Ave NW
- 435 Hazlett Ave NW
- 0 Harrison Ave NW
- 202 Lincoln Ave NW
- 2914 7th St NW
- 2916 11th St NW
- 2817 2nd St NW
- 241 Raymont Ct SW
- 1520 11th St NW
- 1409 8th St NW
- 1405 8th St NW
- 3115 2nd St NW
- 2239 7th St NW
- 2232 8th St NW
- 2236 8th St NW
- 2243 7th St NW Unit 2243
- 2225 7th St NW
- 2228 8th St NW
- 2241 7th St NW
- 624 Smith Ave NW
- 2221 7th St NW
- 2305 7th St NW
- 2220 8th St NW
- 620 Smith Ave NW
- 801 Halter Ct NW
- 625 Smith Ave NW
- 2226 7th St NW
- 800 Smith Ave NW
- 2235 8th St NW
- 805 Halter Ct NW
- 2222 7th St NW
- 616 Smith Ave NW