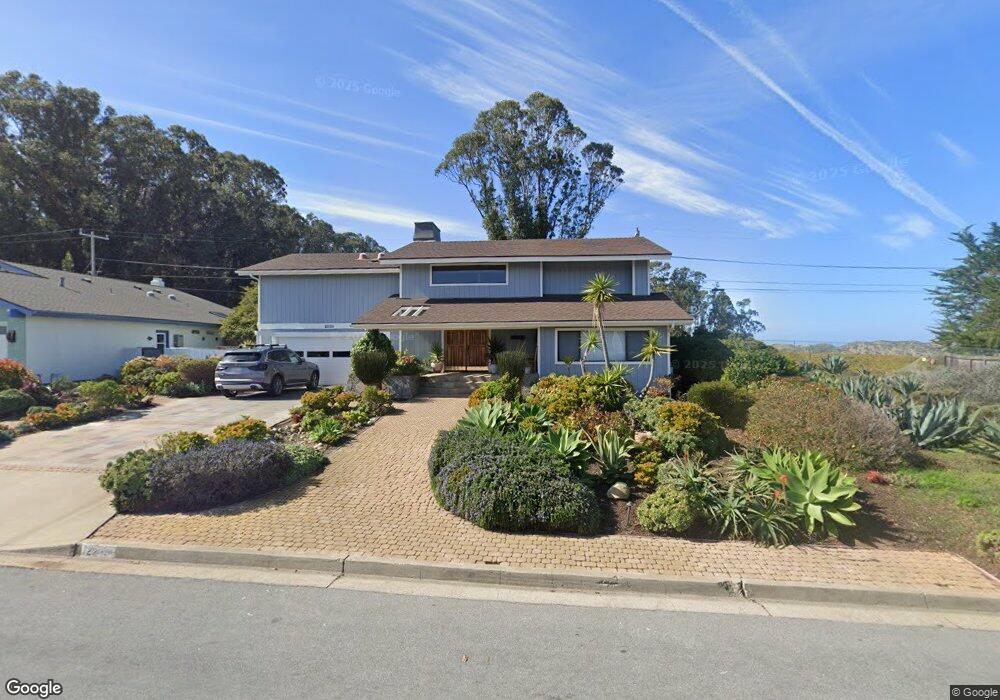
2233 Inyo St Los Osos, CA 93402
Estimated Value: $1,117,296 - $1,202,000
3
Beds
2
Baths
2,161
Sq Ft
$543/Sq Ft
Est. Value
About This Home
This home is located at 2233 Inyo St, Los Osos, CA 93402 and is currently estimated at $1,173,824, approximately $543 per square foot. 2233 Inyo St is a home located in San Luis Obispo County with nearby schools including Monarch Grove Elementary School, Los Osos Middle School, and Morro Bay High School.
Ownership History
Date
Name
Owned For
Owner Type
Purchase Details
Closed on
Jan 31, 2006
Sold by
Robison Tracy A
Bought by
Robison Tracy A and Tracy A Robison Revocable Trus
Current Estimated Value
Home Financials for this Owner
Home Financials are based on the most recent Mortgage that was taken out on this home.
Original Mortgage
$150,000
Interest Rate
6.21%
Mortgage Type
Credit Line Revolving
Purchase Details
Closed on
Jul 22, 2004
Sold by
Robison Tracy A
Bought by
Robison Tracy A and The Tracy A Robison Revocable
Purchase Details
Closed on
Dec 31, 1996
Sold by
Robison John C and Robison Tracy A
Bought by
Robison Tracy A
Create a Home Valuation Report for This Property
The Home Valuation Report is an in-depth analysis detailing your home's value as well as a comparison with similar homes in the area
Home Values in the Area
Average Home Value in this Area
Purchase History
| Date | Buyer | Sale Price | Title Company |
|---|---|---|---|
| Robison Tracy A | -- | Accommodation | |
| Robison Tracy A | -- | Cuesta Title Company | |
| Robison Tracy A | -- | -- | |
| Robison Tracy A | -- | -- |
Source: Public Records
Mortgage History
| Date | Status | Borrower | Loan Amount |
|---|---|---|---|
| Closed | Robison Tracy A | $150,000 |
Source: Public Records
Tax History Compared to Growth
Tax History
| Year | Tax Paid | Tax Assessment Tax Assessment Total Assessment is a certain percentage of the fair market value that is determined by local assessors to be the total taxable value of land and additions on the property. | Land | Improvement |
|---|---|---|---|---|
| 2025 | $6,341 | $308,626 | $129,421 | $179,205 |
| 2024 | $6,228 | $302,576 | $126,884 | $175,692 |
| 2023 | $6,228 | $296,645 | $124,397 | $172,248 |
| 2022 | $5,819 | $290,829 | $121,958 | $168,871 |
| 2021 | $5,750 | $285,127 | $119,567 | $165,560 |
| 2020 | $5,403 | $282,204 | $118,341 | $163,863 |
| 2019 | $5,322 | $276,671 | $116,021 | $160,650 |
| 2018 | $5,108 | $271,247 | $113,747 | $157,500 |
| 2017 | $4,993 | $265,929 | $111,517 | $154,412 |
| 2016 | $3,767 | $260,716 | $109,331 | $151,385 |
| 2015 | $3,724 | $256,801 | $107,689 | $149,112 |
| 2014 | $3,493 | $251,772 | $105,580 | $146,192 |
Source: Public Records
Map
Nearby Homes