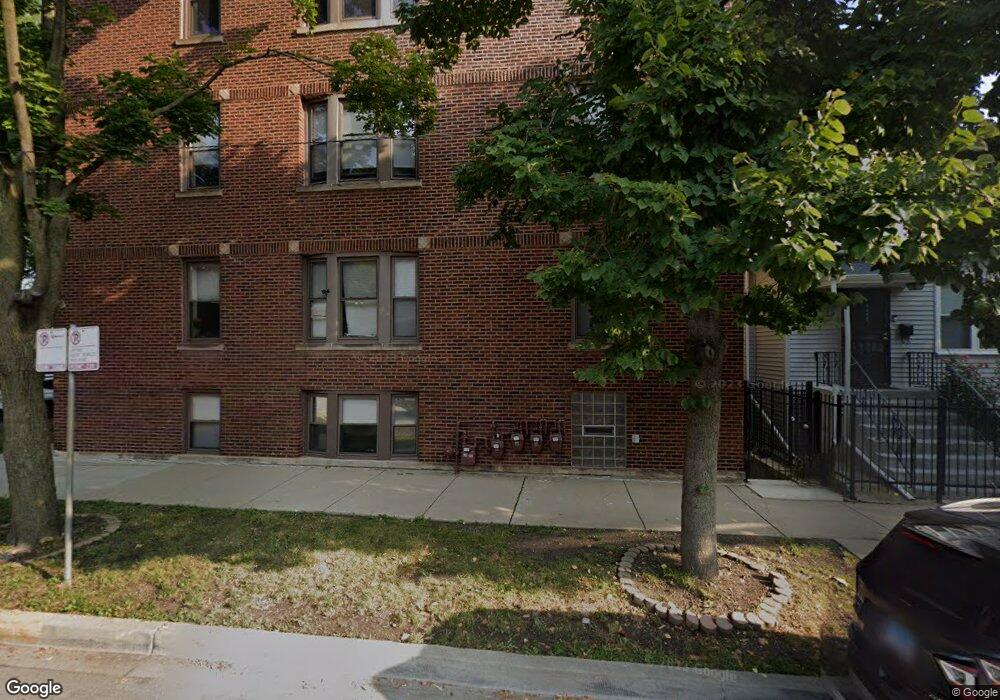
2233 N Saint Louis Ave Unit 223 Chicago, IL 60647
Logan Square NeighborhoodEstimated Value: $313,000 - $385,000
2
Beds
1
Bath
1,049
Sq Ft
$340/Sq Ft
Est. Value
About This Home
This home is located at 2233 N Saint Louis Ave Unit 223, Chicago, IL 60647 and is currently estimated at $357,030, approximately $340 per square foot. 2233 N Saint Louis Ave Unit 223 is a home located in Cook County with nearby schools including Darwin Elementary School, Kelvyn Park High School, and Good Shepherd Christian Academy.
Ownership History
Date
Name
Owned For
Owner Type
Purchase Details
Closed on
Feb 4, 2020
Sold by
Nero Alex
Bought by
Trinidad Justin S
Current Estimated Value
Home Financials for this Owner
Home Financials are based on the most recent Mortgage that was taken out on this home.
Original Mortgage
$157,140
Outstanding Balance
$139,189
Interest Rate
3.62%
Mortgage Type
New Conventional
Estimated Equity
$217,841
Purchase Details
Closed on
Sep 17, 2015
Sold by
Quinones Angel
Bought by
Nero Alex
Home Financials for this Owner
Home Financials are based on the most recent Mortgage that was taken out on this home.
Original Mortgage
$130,150
Interest Rate
4.12%
Mortgage Type
New Conventional
Purchase Details
Closed on
Jun 12, 2012
Sold by
Wells Fargo Bank Na
Bought by
Quinones Angel
Purchase Details
Closed on
Jan 12, 2012
Sold by
Petrunich Bever6y and Petrunich Beverly A
Bought by
Wells Fargo Bank Na
Create a Home Valuation Report for This Property
The Home Valuation Report is an in-depth analysis detailing your home's value as well as a comparison with similar homes in the area
Home Values in the Area
Average Home Value in this Area
Purchase History
| Date | Buyer | Sale Price | Title Company |
|---|---|---|---|
| Trinidad Justin S | $162,000 | Proper Title Llc | |
| Nero Alex | $137,000 | Heritage Title Company | |
| Quinones Angel | $18,500 | First American Title | |
| Wells Fargo Bank Na | -- | None Available |
Source: Public Records
Mortgage History
| Date | Status | Borrower | Loan Amount |
|---|---|---|---|
| Open | Trinidad Justin S | $157,140 | |
| Previous Owner | Nero Alex | $130,150 |
Source: Public Records
Tax History Compared to Growth
Tax History
| Year | Tax Paid | Tax Assessment Tax Assessment Total Assessment is a certain percentage of the fair market value that is determined by local assessors to be the total taxable value of land and additions on the property. | Land | Improvement |
|---|---|---|---|---|
| 2024 | $6,352 | $33,812 | $2,255 | $31,557 |
| 2023 | $6,191 | $30,000 | $1,828 | $28,172 |
| 2022 | $6,191 | $30,000 | $1,828 | $28,172 |
| 2021 | $6,052 | $29,999 | $1,828 | $28,171 |
| 2020 | $4,847 | $24,781 | $883 | $23,898 |
| 2019 | $4,919 | $27,824 | $883 | $26,941 |
| 2018 | $4,818 | $27,824 | $883 | $26,941 |
| 2017 | $4,572 | $24,616 | $792 | $23,824 |
| 2016 | $4,430 | $24,616 | $792 | $23,824 |
| 2015 | $4,511 | $24,616 | $792 | $23,824 |
| 2014 | $4,349 | $23,438 | $731 | $22,707 |
| 2013 | $4,263 | $23,438 | $731 | $22,707 |
Source: Public Records
Map
Nearby Homes
- 3430 W Lyndale St
- 3434 W Palmer St
- 2305 N Kimball Ave Unit G
- 2342 N Kimball Ave
- 3547 W Belden Ave
- 2121 N Saint Louis Ave Unit 3S
- 3566 W Palmer St
- 2337 N Sawyer Ave
- 1617 N Sawyer Ave
- 2323 N Monticello Ave
- 2330 N Kedzie Blvd
- 3575 W Dickens Ave
- 2421 N Sawyer Ave Unit 1
- 3522 W Armitage Ave
- 2512 N Kimball Ave
- 3219 W Dickens Ave
- 2137 N Kedzie Blvd Unit G
- 3659 W Palmer St
- 2139 N Kedzie Blvd Unit 2
- 2343 N Lawndale Ave
- 2233 N Saint Louis Ave Unit 223
- 2233 N Saint Louis Ave Unit 223
- 2233 N Saint Louis Ave Unit 223
- 2233 N Saint Louis Ave Unit 3
- 2233 N Saint Louis Ave Unit 1
- 2233 N Saint Louis Ave Unit 2
- 2233 N Saint Louis Ave Unit G
- 2237 N Saint Louis Ave Unit 223
- 2237 N Saint Louis Ave Unit 223
- 2237 N Saint Louis Ave Unit 223
- 2237 N Saint Louis Ave Unit 3
- 2237 N Saint Louis Ave Unit 2
- 2237 N Saint Louis Ave Unit 1
- 2239 N Saint Louis Ave Unit 223
- 2239 N Saint Louis Ave Unit 223
- 2239 N Saint Louis Ave Unit 223
- 2239 N Saint Louis Ave Unit 1
- 2239 N Saint Louis Ave Unit 3
- 2235 N Saint Louis Ave Unit 223
- 2235 N Saint Louis Ave Unit 223