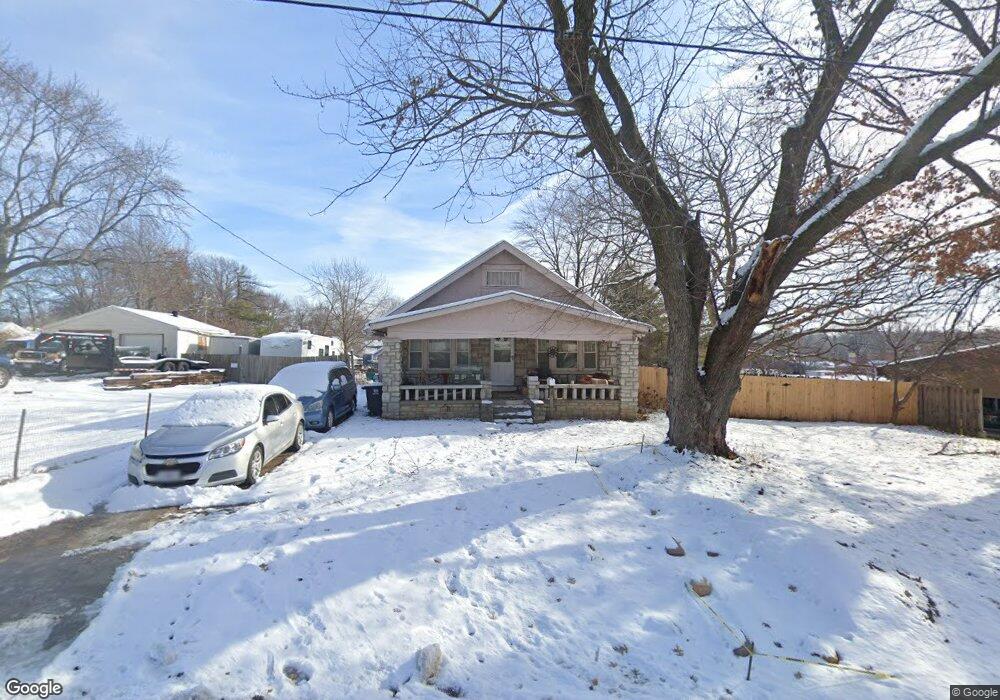
2233 S Vermont Ave Independence, MO 64052
Procter NeighborhoodEstimated Value: $136,000 - $195,000
3
Beds
1
Bath
1,209
Sq Ft
$137/Sq Ft
Est. Value
About This Home
This home is located at 2233 S Vermont Ave, Independence, MO 64052 and is currently estimated at $165,058, approximately $136 per square foot. 2233 S Vermont Ave is a home located in Jackson County with nearby schools including Sugar Creek Elementary School, Abraham Mallinson Elementary, and Clifford H. Nowlin Middle School.
Ownership History
Date
Name
Owned For
Owner Type
Purchase Details
Closed on
Oct 12, 2010
Sold by
Moore Glennis Kay and Moore Marvin J
Bought by
Moore Allison Faye
Current Estimated Value
Purchase Details
Closed on
Mar 7, 2003
Sold by
Moore Glennis K and Graves Mildred O
Bought by
Moore Allison Faye and Taylor Hutcherson Lori Ann
Purchase Details
Closed on
Feb 28, 1997
Sold by
Linson Helen L
Bought by
Linson James L
Create a Home Valuation Report for This Property
The Home Valuation Report is an in-depth analysis detailing your home's value as well as a comparison with similar homes in the area
Home Values in the Area
Average Home Value in this Area
Purchase History
| Date | Buyer | Sale Price | Title Company |
|---|---|---|---|
| Moore Allison Faye | -- | None Available | |
| Moore Allison Faye | -- | Heart Of America Title Inc | |
| Moore Glennis K | -- | Heart Of American Title Inc | |
| Linson James L | -- | -- |
Source: Public Records
Tax History Compared to Growth
Tax History
| Year | Tax Paid | Tax Assessment Tax Assessment Total Assessment is a certain percentage of the fair market value that is determined by local assessors to be the total taxable value of land and additions on the property. | Land | Improvement |
|---|---|---|---|---|
| 2025 | $1,352 | $19,097 | $4,518 | $14,579 |
| 2024 | $1,319 | $18,964 | $3,639 | $15,325 |
| 2023 | $1,319 | $18,964 | $1,946 | $17,018 |
| 2022 | $1,100 | $14,440 | $2,994 | $11,446 |
| 2021 | $1,096 | $14,440 | $2,994 | $11,446 |
| 2020 | $1,123 | $14,411 | $2,994 | $11,417 |
| 2019 | $1,106 | $14,411 | $2,994 | $11,417 |
| 2018 | $991 | $12,541 | $2,605 | $9,936 |
| 2017 | $1,004 | $12,541 | $2,605 | $9,936 |
| 2016 | $1,004 | $12,408 | $2,936 | $9,472 |
| 2014 | $954 | $12,046 | $2,850 | $9,196 |
Source: Public Records
Map
Nearby Homes
- 2020 S Vermont Ave
- 2000 S Vermont Ave
- 2353 Englewood Ct
- 2419 S Vermont Ave
- 11317 E Winner Rd
- 11305 E Winner Rd
- 812 S Woodland Ave
- 10812 & 10814 E 19th Terrace
- 10710 E 24th St S
- 10626 E 23rd St S
- 2005 S Hedges Ave
- 2022 S Hedges Ave
- 2700 Englewood Terrace
- 809 S Crysler Ave
- 2710 S Claremont Ave
- 1911 S Ralston Ave
- 10816 E 27th St S
- 1512 W 27th Terrace S
- 1110 W 24th St S
- 709 S Willis Ave
- 2229 S Vermont Ave
- 2236 S Vermont Ave Unit 1
- 2236 S Vermont Ave
- 2230 S Vermont Ave
- 2225 S Vermont Ave
- 2226 S Vermont Ave
- 2222 S Vermont Ave
- 2220 S Vermont Ave
- 2130 S Norwood Ave
- 2132 S Norwood Ave
- 2128 S Norwood Ave
- 2134 S Norwood Ave
- 2223 S Vermont Ave
- 2220 S Vermont Ave
- 2126 S Norwood Ave
- 2136 S Norwood Ave
- 2124 S Norwood Ave
- 2200 S Vermont Ave
- 2122 S Norwood Ave
- 11327 E 23rd St S