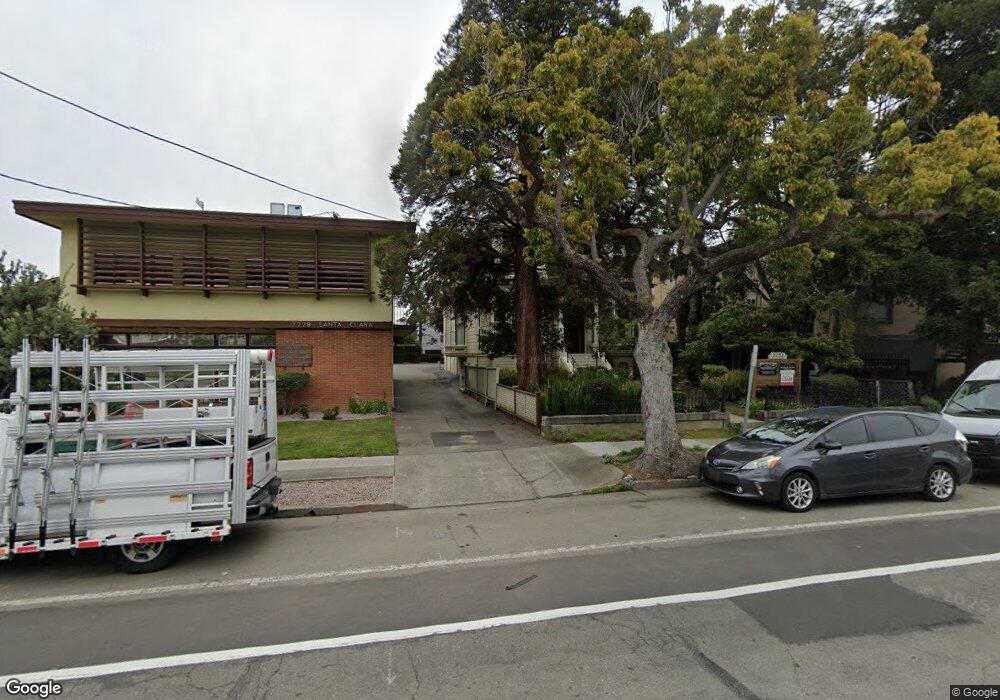
2233 Santa Clara Ave Alameda, CA 94501
Downtown Alameda NeighborhoodEstimated Value: $1,716,948
--
Bed
3
Baths
5,094
Sq Ft
$337/Sq Ft
Est. Value
About This Home
This home is located at 2233 Santa Clara Ave, Alameda, CA 94501 and is currently estimated at $1,716,948, approximately $337 per square foot. 2233 Santa Clara Ave is a home located in Alameda County with nearby schools including Love Elementary, Will C. Wood Middle School, and Alameda High School.
Ownership History
Date
Name
Owned For
Owner Type
Purchase Details
Closed on
Oct 4, 2018
Sold by
Tam Mary Ma Li and Tam Andrew
Bought by
Mansard Llc
Current Estimated Value
Home Financials for this Owner
Home Financials are based on the most recent Mortgage that was taken out on this home.
Original Mortgage
$926,250
Outstanding Balance
$807,745
Interest Rate
4.5%
Mortgage Type
Commercial
Estimated Equity
$909,203
Purchase Details
Closed on
Apr 3, 2017
Sold by
Li Tam Harold Kwong Sang and Li Tam Mary Ma
Bought by
Li Tam Harold Kwong Sang and Li Tam Mary Ma
Purchase Details
Closed on
Nov 15, 2010
Sold by
Musso Donald F and Rose L Pedemonte Trust
Bought by
Tam Kwong Sang and Tam Mary Mali
Purchase Details
Closed on
Oct 4, 2003
Sold by
Musso Donald F and The Musso Family Trust B
Bought by
The Johnston Family Trust and The Musso Family Trust
Purchase Details
Closed on
Sep 22, 1993
Sold by
Winters Nellie J
Bought by
Musso Edith and Pedemonte Rose L
Create a Home Valuation Report for This Property
The Home Valuation Report is an in-depth analysis detailing your home's value as well as a comparison with similar homes in the area
Home Values in the Area
Average Home Value in this Area
Purchase History
| Date | Buyer | Sale Price | Title Company |
|---|---|---|---|
| Mansard Llc | $1,415,000 | Old Republic Title Company | |
| Li Tam Harold Kwong Sang | -- | None Available | |
| Tam Kwong Sang | $986,000 | First American Title Company | |
| Musso Donald F | $986,000 | First American Title Company | |
| The Johnston Family Trust | -- | -- | |
| Musso Edith | -- | Fidelity National Title Ins |
Source: Public Records
Mortgage History
| Date | Status | Borrower | Loan Amount |
|---|---|---|---|
| Open | Mansard Llc | $926,250 |
Source: Public Records
Tax History Compared to Growth
Tax History
| Year | Tax Paid | Tax Assessment Tax Assessment Total Assessment is a certain percentage of the fair market value that is determined by local assessors to be the total taxable value of land and additions on the property. | Land | Improvement |
|---|---|---|---|---|
| 2025 | $23,706 | $1,578,432 | $529,862 | $1,048,570 |
| 2024 | $23,706 | $1,547,486 | $519,474 | $1,028,012 |
| 2023 | $22,763 | $1,517,148 | $509,290 | $1,007,858 |
| 2022 | $22,262 | $1,487,404 | $499,305 | $988,099 |
| 2021 | $21,765 | $1,458,242 | $489,516 | $968,726 |
| 2020 | $21,583 | $1,443,300 | $484,500 | $958,800 |
| 2019 | $19,944 | $1,415,000 | $475,000 | $940,000 |
| 2018 | $16,267 | $1,110,196 | $354,677 | $755,519 |
| 2017 | $15,520 | $1,088,435 | $347,725 | $740,710 |
| 2016 | $15,723 | $1,067,097 | $340,908 | $726,189 |
| 2015 | $15,628 | $1,051,076 | $335,790 | $715,286 |
| 2014 | $14,628 | $1,030,487 | $329,212 | $701,275 |
Source: Public Records
Map
Nearby Homes
- 2216 Santa Clara Ave
- 1611 Lea Ct
- 2310 Pacific Ave
- 2151 Alameda Ave
- 2109 Lincoln Ave
- 2308 Encinal Ave
- 2119 Alameda Ave
- 2056 Santa Clara Ave
- 2057 Central Ave
- 2417 Marti Rae Ct
- 1251 Park St
- 2120 Encinal Ave
- 2061 Buena Vista Ave
- 1601 Broadway Unit 9
- 2060 San Antonio Ave
- 1542 Broadway
- 1421 Chestnut St
- 1220 Chestnut St
- 2133 Clinton Ave
- 2055 Clement Ave
- 12 Yukker
- 2232 Santa Clara Ave
- 2224 Lincoln Ave
- 2236 Lincoln Ave
- 2209 Santa Clara Ave
- 2211 Santa Clara Ave
- 2207 Santa Clara Ave
- 2205 Santa Clara Ave
- 2220 Santa Clara Ave Unit C
- 2220 Santa Clara Ave
- 1520 Walnut St
- 2208 Santa Clara Ave
- 1518 Walnut St
- 1508 Walnut St
- 2214 Santa Clara Ave
- 1522 Walnut St
- 2201 Santa Clara Ave Unit C
- 2201 Santa Clara Ave Unit B
- 2203 Santa Clara Ave
- 2206 Lincoln Ave