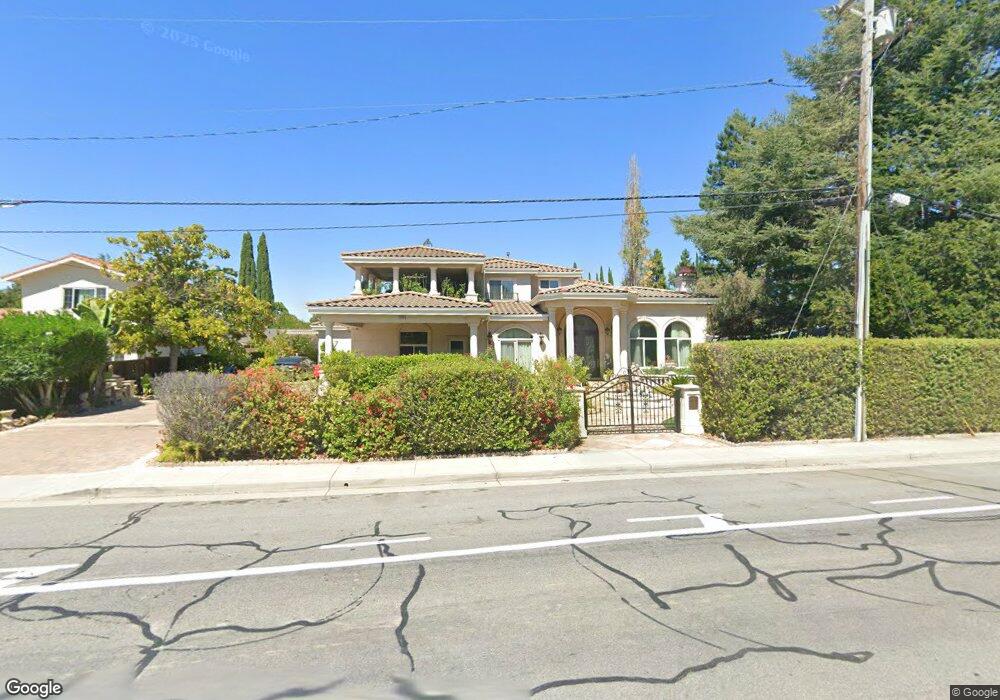
22333 Stevens Creek Blvd Cupertino, CA 95014
McClellan NeighborhoodEstimated Value: $3,287,000 - $5,664,000
6
Beds
6
Baths
5,173
Sq Ft
$942/Sq Ft
Est. Value
About This Home
This home is located at 22333 Stevens Creek Blvd, Cupertino, CA 95014 and is currently estimated at $4,872,748, approximately $941 per square foot. 22333 Stevens Creek Blvd is a home located in Santa Clara County with nearby schools including Stevens Creek Elementary School, John F. Kennedy Middle School, and Monta Vista High School.
Ownership History
Date
Name
Owned For
Owner Type
Purchase Details
Closed on
Mar 11, 2002
Sold by
Esmaili Sirous and Nazari Pari Jarrahi
Bought by
Cheng Gu Qing and Yang Ling
Current Estimated Value
Home Financials for this Owner
Home Financials are based on the most recent Mortgage that was taken out on this home.
Original Mortgage
$479,000
Interest Rate
6.25%
Purchase Details
Closed on
Dec 18, 1996
Sold by
Swistak Marthene A
Bought by
Esmaili Sirous and Nazari Pari Jarrahl
Home Financials for this Owner
Home Financials are based on the most recent Mortgage that was taken out on this home.
Original Mortgage
$287,200
Interest Rate
7.62%
Create a Home Valuation Report for This Property
The Home Valuation Report is an in-depth analysis detailing your home's value as well as a comparison with similar homes in the area
Home Values in the Area
Average Home Value in this Area
Purchase History
| Date | Buyer | Sale Price | Title Company |
|---|---|---|---|
| Cheng Gu Qing | $799,000 | Financial Title Company | |
| Esmaili Sirous | $359,000 | American Title Co |
Source: Public Records
Mortgage History
| Date | Status | Borrower | Loan Amount |
|---|---|---|---|
| Previous Owner | Cheng Gu Qing | $479,000 | |
| Previous Owner | Esmaili Sirous | $287,200 |
Source: Public Records
Tax History Compared to Growth
Tax History
| Year | Tax Paid | Tax Assessment Tax Assessment Total Assessment is a certain percentage of the fair market value that is determined by local assessors to be the total taxable value of land and additions on the property. | Land | Improvement |
|---|---|---|---|---|
| 2025 | $31,590 | $2,611,205 | $1,107,968 | $1,503,237 |
| 2024 | $31,590 | $2,560,006 | $1,086,244 | $1,473,762 |
| 2023 | $31,288 | $2,509,811 | $1,064,946 | $1,444,865 |
| 2022 | $30,828 | $2,460,600 | $1,044,065 | $1,416,535 |
| 2021 | $30,484 | $2,412,354 | $1,023,594 | $1,388,760 |
| 2020 | $29,968 | $2,387,619 | $1,013,099 | $1,374,520 |
| 2019 | $29,212 | $2,340,804 | $993,235 | $1,347,569 |
| 2018 | $28,397 | $2,294,907 | $973,760 | $1,321,147 |
| 2017 | $28,194 | $2,249,910 | $954,667 | $1,295,243 |
| 2016 | $27,285 | $2,205,796 | $935,949 | $1,269,847 |
| 2015 | $27,074 | $2,172,664 | $921,891 | $1,250,773 |
| 2014 | $26,363 | $2,130,106 | $903,833 | $1,226,273 |
Source: Public Records
Map
Nearby Homes
- 10143 Hillcrest Rd
- 22113 Stocklmeir Ct
- 10063 Long Oak Ln
- 21851 Almaden Ave
- 10546 Merriman Rd
- 10500 Creston Dr
- 22346 Mcclellan Rd
- 10350 Mann Dr
- 22941 Longdown Rd
- 21685 Olive Ave
- 21670 Lomita
- 10091 Santa Clara Ave
- 22645 San Juan Rd
- 00 San Juan Rd
- 22081 Caroline Dr
- 10893 Canyon Vista Dr
- 10461 Mary Ave Unit 73
- 10961 Kester Dr
- 10881 Barranca Dr
- 10405 Mary Ave
- 22311 Stevens Creek Blvd
- 22347 Stevens Creek Blvd
- 22328 Cupertino Rd
- 22309 Stevens Creek Blvd
- 22340 Cupertino Rd
- 22287 Stevens Creek Blvd Unit B
- 22287 Stevens Creek Blvd
- 22363 Stevens Creek Blvd
- 10138 Cass Place
- 22322 Cupertino Rd
- 22334 Cupertino Rd
- 22350 Cupertino Rd
- 10139 Cass Place
- 10148 Cass Place
- 10075 Carmen Rd
- 22314 Cupertino Rd
- 10059 Carmen Rd
- 22362 Cupertino Rd
- 22377 Stevens Creek Blvd
- 10055 Carmen Rd