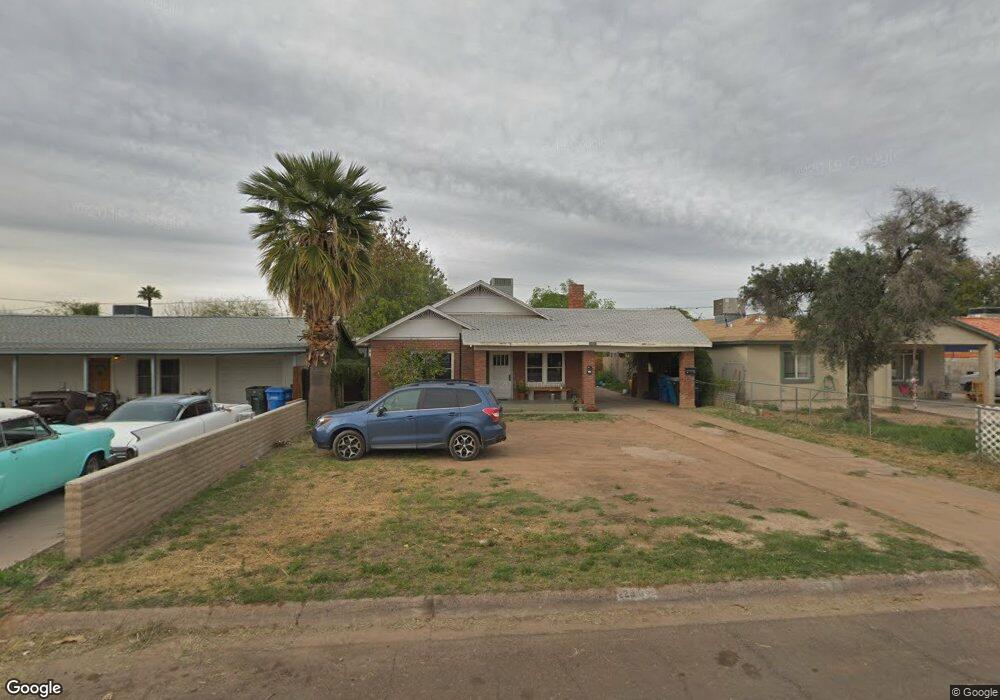
2234 E Sheridan St Unit B Phoenix, AZ 85006
Central City NeighborhoodEstimated Value: $444,000 - $567,000
2
Beds
1
Bath
1,000
Sq Ft
$502/Sq Ft
Est. Value
About This Home
This home is located at 2234 E Sheridan St Unit B, Phoenix, AZ 85006 and is currently estimated at $501,841, approximately $501 per square foot. 2234 E Sheridan St Unit B is a home located in Maricopa County with nearby schools including William T Machan Elementary School, Camelback High School, and Phoenix Coding Academy.
Ownership History
Date
Name
Owned For
Owner Type
Purchase Details
Closed on
Mar 30, 2017
Sold by
Tang Yi
Bought by
Zhao Jianwu
Current Estimated Value
Home Financials for this Owner
Home Financials are based on the most recent Mortgage that was taken out on this home.
Original Mortgage
$113,250
Outstanding Balance
$58,431
Interest Rate
4.16%
Mortgage Type
Reverse Mortgage Home Equity Conversion Mortgage
Estimated Equity
$443,410
Purchase Details
Closed on
Mar 16, 2001
Sold by
Ellis Teri Schienle and Ellis Roland
Bought by
Ellis Hebert Roland and Ellis Teri
Purchase Details
Closed on
Oct 16, 1995
Sold by
Ellis Teri Schienle and Ellis Roland
Bought by
Ellis Teri Schienle and Ellis Roland
Purchase Details
Closed on
Sep 6, 1994
Sold by
Schienle Raymond L and Schienle Teri
Bought by
Ellis Roland and Ellis Teri
Purchase Details
Closed on
Jul 13, 1994
Sold by
Thompson Willie L
Bought by
Hawkins Roy D and Hawkins Idella M
Create a Home Valuation Report for This Property
The Home Valuation Report is an in-depth analysis detailing your home's value as well as a comparison with similar homes in the area
Home Values in the Area
Average Home Value in this Area
Purchase History
| Date | Buyer | Sale Price | Title Company |
|---|---|---|---|
| Zhao Jianwu | -- | Chicago Title | |
| Zhao Jianwu | $151,000 | Chicago Title Agency Inc | |
| Ellis Hebert Roland | -- | First American Title | |
| Ellis Teri Schienle | -- | First American Title Co | |
| Ellis Roland | -- | -- | |
| Hawkins Roy D | -- | -- |
Source: Public Records
Mortgage History
| Date | Status | Borrower | Loan Amount |
|---|---|---|---|
| Open | Zhao Jianwu | $113,250 |
Source: Public Records
Tax History
| Year | Tax Paid | Tax Assessment Tax Assessment Total Assessment is a certain percentage of the fair market value that is determined by local assessors to be the total taxable value of land and additions on the property. | Land | Improvement |
|---|---|---|---|---|
| 2025 | $1,321 | $9,783 | -- | -- |
| 2024 | $1,257 | $9,317 | -- | -- |
| 2023 | $1,257 | $36,030 | $7,200 | $28,830 |
| 2022 | $1,180 | $26,910 | $5,380 | $21,530 |
| 2021 | $1,212 | $22,670 | $4,530 | $18,140 |
| 2020 | $1,182 | $18,400 | $3,680 | $14,720 |
| 2019 | $1,174 | $15,360 | $3,070 | $12,290 |
| 2018 | $1,150 | $12,860 | $2,570 | $10,290 |
| 2017 | $1,105 | $12,510 | $2,500 | $10,010 |
| 2016 | $1,061 | $10,460 | $2,090 | $8,370 |
| 2015 | $988 | $9,200 | $1,840 | $7,360 |
Source: Public Records
Map
Nearby Homes
- 2210 E Sheridan St Unit 16
- 2242 E Harvard St
- 2217 E Sheridan St
- 2302 E Yale St
- 2312 E Harvard St
- 2210 E Cambridge Ave
- 2209 E Windsor Ave
- 2101 E Virginia Ave
- 2825 N Greenfield Rd
- 2419 E Oak St
- 2047 E Virginia Ave
- 2041 E Harvard St
- 2214 N 24th Place
- 2218 N 21st Place
- 2215 N 21st St
- 2037 N 22nd St
- 2029 N 22nd Place
- 2112 N 24th Place
- 1950 E Yale St
- 2601 E Virginia Ave
- 2234 E Sheridan St
- 2238 E Sheridan St
- 2226 E Sheridan St
- 2242 E Sheridan St
- 2233 E Yale St
- 2229 E Yale St
- 2222 R E Sheridan St
- 2222 E Sheridan St
- 2237 E Yale St
- 2227 E Yale St
- 2233 E Sheridan St
- 2245 E Yale St
- 2237 E Sheridan St
- 2221 E Yale St
- 2241 E Sheridan St
- 2225 E Sheridan St
- 2210 E Sheridan St
- 2229 E Sheridan St
- 2217 E Yale St
- 2221 E Sheridan St
Your Personal Tour Guide
Ask me questions while you tour the home.