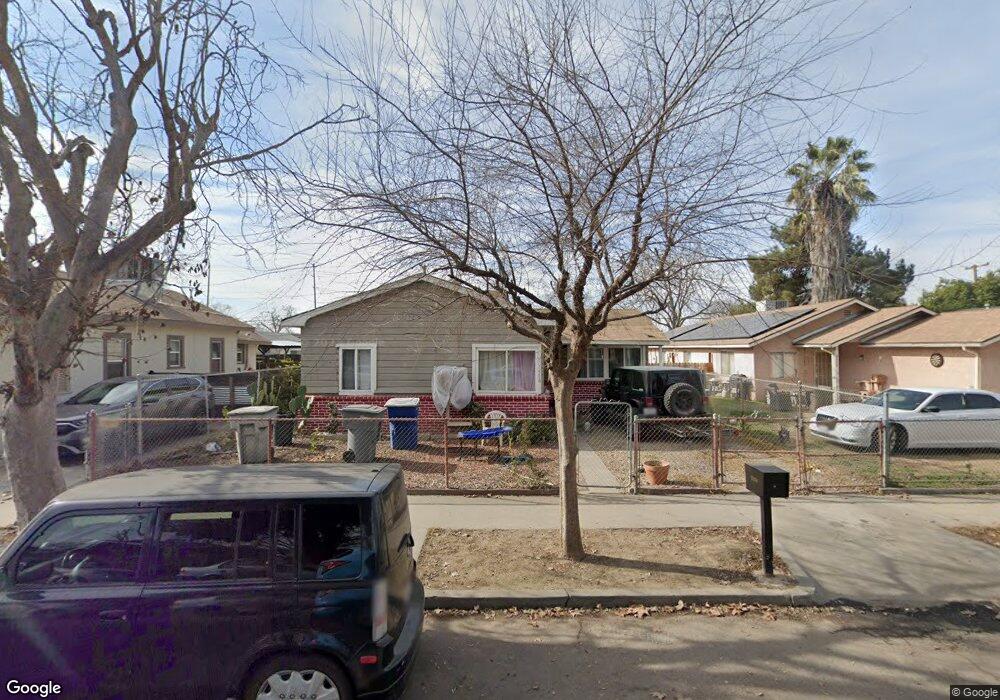
2234 S Nicholas Ave Fresno, CA 93706
Edison NeighborhoodEstimated Value: $158,000 - $289,000
3
Beds
1
Bath
1,012
Sq Ft
$229/Sq Ft
Est. Value
About This Home
This home is located at 2234 S Nicholas Ave, Fresno, CA 93706 and is currently estimated at $231,782, approximately $229 per square foot. 2234 S Nicholas Ave is a home located in Fresno County with nearby schools including Kirk Elementary School, Rutherford B. Gaston Sr. Middle, and Edison High School.
Ownership History
Date
Name
Owned For
Owner Type
Purchase Details
Closed on
Aug 26, 2025
Sold by
Cresencio Sanchez V and Garcia Soledad
Bought by
Cresencio Sanchez V And Soledad Garcia Sanche and Sanchez
Current Estimated Value
Purchase Details
Closed on
Jul 22, 2023
Sold by
Contreras Dominga Vasquez and Contreras Cresencio Sanchez
Bought by
Sanchez Cresencio
Purchase Details
Closed on
Jul 17, 2023
Sold by
Contreras Dominga Vasquez and Contreras Cresencio Sanchez
Bought by
Sanchez Cresencio
Purchase Details
Closed on
May 26, 2016
Sold by
Sanchez Crescencio V
Bought by
Contreras Dominga Vasquez and Crescencio Sanchez V
Purchase Details
Closed on
Feb 5, 2016
Sold by
Burbank Russell K
Bought by
Sanchez V Crescencio
Purchase Details
Closed on
Oct 27, 2015
Sold by
Torres Aida
Bought by
Cal State Growth Fund
Purchase Details
Closed on
Jun 3, 1998
Sold by
Gomez Julian S
Bought by
Gomez Julian S and Torres Aida
Home Financials for this Owner
Home Financials are based on the most recent Mortgage that was taken out on this home.
Original Mortgage
$18,000
Interest Rate
7.11%
Create a Home Valuation Report for This Property
The Home Valuation Report is an in-depth analysis detailing your home's value as well as a comparison with similar homes in the area
Home Values in the Area
Average Home Value in this Area
Purchase History
| Date | Buyer | Sale Price | Title Company |
|---|---|---|---|
| Cresencio Sanchez V And Soledad Garcia Sanche | -- | None Listed On Document | |
| Sanchez Cresencio | -- | None Listed On Document | |
| Sanchez Cresencio | -- | None Listed On Document | |
| Contreras Dominga Vasquez | -- | None Available | |
| Sanchez V Crescencio | $45,000 | Chicago Title Company | |
| Cal State Growth Fund | $25,000 | Accommodation | |
| Gomez Julian S | -- | Fidelity National Title Co |
Source: Public Records
Mortgage History
| Date | Status | Borrower | Loan Amount |
|---|---|---|---|
| Previous Owner | Gomez Julian S | $18,000 |
Source: Public Records
Tax History Compared to Growth
Tax History
| Year | Tax Paid | Tax Assessment Tax Assessment Total Assessment is a certain percentage of the fair market value that is determined by local assessors to be the total taxable value of land and additions on the property. | Land | Improvement |
|---|---|---|---|---|
| 2025 | $737 | $53,265 | $23,674 | $29,591 |
| 2023 | $698 | $51,198 | $22,755 | $28,443 |
| 2022 | $689 | $50,195 | $22,309 | $27,886 |
| 2021 | $671 | $49,212 | $21,872 | $27,340 |
| 2020 | $669 | $48,708 | $21,648 | $27,060 |
| 2019 | $644 | $47,754 | $21,224 | $26,530 |
| 2018 | $631 | $46,818 | $20,808 | $26,010 |
| 2017 | $621 | $45,900 | $20,400 | $25,500 |
| 2016 | $602 | $45,000 | $20,000 | $25,000 |
| 2015 | $219 | $18,979 | $6,122 | $12,857 |
| 2014 | $212 | $18,609 | $6,003 | $12,606 |
Source: Public Records
Map
Nearby Homes
- 2261 S Nicholas Ave
- 2255 S Rose Ave
- 2358 S Anna St
- 2371 S Lily Ave
- 2338 S Lotus Ave
- 162 E St
- 2312 S Holly Ave
- 222 E St
- 2225 S Poppy Ave
- 2337 S Poppy Ave
- 3012 E Belgravia Ave
- 2305 S Elm Ave
- 2458 S Poppy Ave
- 450 C St
- 2523 S Lily Ave
- 2316 S Eunice Ave
- 2318 S Eunice Ave
- 564 F St
- 2537 S Holly Ave
- 2555 S Lotus Ave
- 2242 S Nicholas Ave
- 2228 S Nicholas Ave
- 2220 S Nicholas Ave
- 2250 S Nicholas Ave
- 2258 S Nicholas Ave
- 2212 S Nicholas Ave
- 2231 S Rose Ave
- 2223 S Rose Ave
- 2241 S Rose Ave
- 2219 S Rose Ave
- 2237 S Nicholas Ave
- 2260 S Nicholas Ave
- 2247 S Rose Ave
- 2241 S Nicholas Ave
- 2221 S Nicholas Ave
- 2202 S Nicholas Ave
- 2209 S Rose Ave
- 2247 S Nicholas Ave
- 2217 S Nicholas Ave
- 2213 S Nicholas Ave