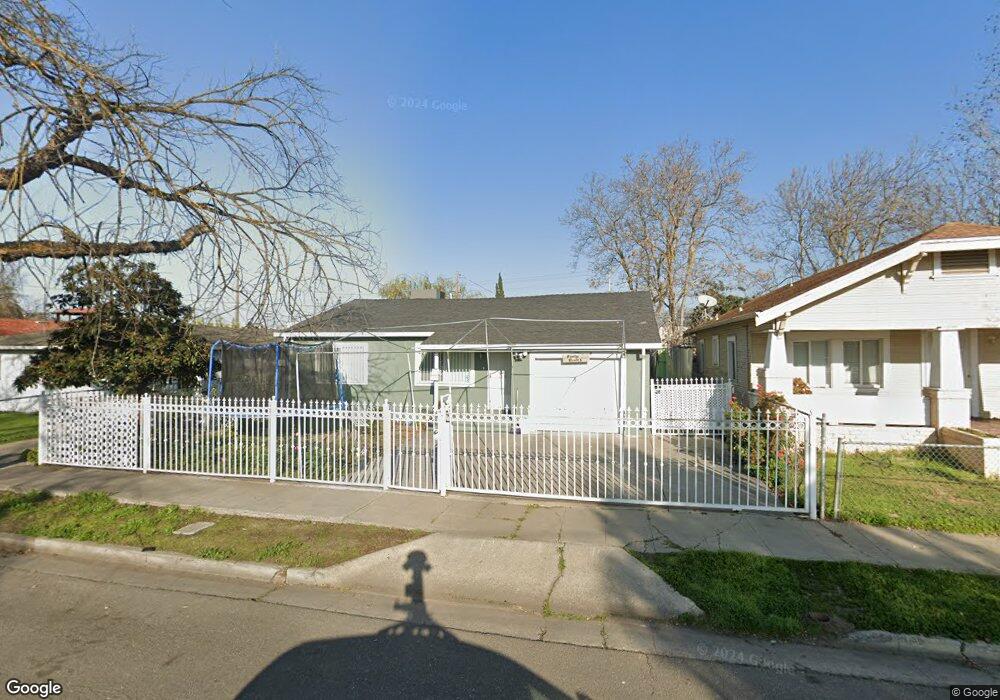
2235 E Marsh St Stockton, CA 95205
East Stockton NeighborhoodEstimated Value: $189,000 - $307,000
3
Beds
1
Bath
1,036
Sq Ft
$261/Sq Ft
Est. Value
About This Home
This home is located at 2235 E Marsh St, Stockton, CA 95205 and is currently estimated at $270,317, approximately $260 per square foot. 2235 E Marsh St is a home located in San Joaquin County with nearby schools including King Elementary School, Roosevelt Elementary School, and John C. Fremont Elementary School.
Ownership History
Date
Name
Owned For
Owner Type
Purchase Details
Closed on
Dec 1, 2011
Sold by
Best Real Estate Investments Inc
Bought by
Mendez Luis M and Cazares Rebecca Pimentel
Current Estimated Value
Home Financials for this Owner
Home Financials are based on the most recent Mortgage that was taken out on this home.
Original Mortgage
$58,950
Outstanding Balance
$40,171
Interest Rate
3.93%
Mortgage Type
New Conventional
Estimated Equity
$230,146
Purchase Details
Closed on
Aug 31, 2011
Sold by
Oconnell William Frank and Oconnell Melody
Bought by
Best Real Estate Investment Inc
Home Financials for this Owner
Home Financials are based on the most recent Mortgage that was taken out on this home.
Original Mortgage
$17,500
Interest Rate
4.46%
Mortgage Type
Seller Take Back
Purchase Details
Closed on
Mar 19, 2009
Sold by
Morcap Real Estate Opportunity Fund I Ll
Bought by
Oconnell William Frank and Oconnell Melody
Purchase Details
Closed on
Feb 6, 2009
Sold by
Realholdings Llc
Bought by
Morcap Real Estate Opportunity Fund I Ll
Purchase Details
Closed on
Oct 31, 2008
Sold by
Blue Spruce Entities Llc
Bought by
Real Holdings Llc
Purchase Details
Closed on
Jun 3, 2008
Sold by
Toki Fukaeiki Tom and Toki Veisinia P
Bought by
Wells Fargo Bank Na and Soundview Home Loan Trust 2007-Opt1 Asse
Purchase Details
Closed on
Jun 25, 2004
Sold by
Toki Fukaeiki Tom
Bought by
Toki Fukaeiki Tom and Toki Veisinia P
Home Financials for this Owner
Home Financials are based on the most recent Mortgage that was taken out on this home.
Original Mortgage
$148,000
Interest Rate
8.5%
Mortgage Type
New Conventional
Purchase Details
Closed on
Dec 22, 2003
Sold by
Torres Ernestine and Johnson Ernestine
Bought by
Toki Fukaeiki Tom
Home Financials for this Owner
Home Financials are based on the most recent Mortgage that was taken out on this home.
Original Mortgage
$127,500
Interest Rate
5.81%
Mortgage Type
Purchase Money Mortgage
Purchase Details
Closed on
Sep 15, 2003
Sold by
Bresock Hal N and Bresock Lorna L
Bought by
Toki Fukaeiki Tom
Home Financials for this Owner
Home Financials are based on the most recent Mortgage that was taken out on this home.
Original Mortgage
$82,500
Interest Rate
6.3%
Mortgage Type
Purchase Money Mortgage
Purchase Details
Closed on
Mar 6, 2000
Sold by
Bresock Leland
Bought by
Bresock Hal N and Bresock Lorna L
Purchase Details
Closed on
Mar 10, 1999
Sold by
Bresock Hal N
Bought by
Bresock Leland
Create a Home Valuation Report for This Property
The Home Valuation Report is an in-depth analysis detailing your home's value as well as a comparison with similar homes in the area
Home Values in the Area
Average Home Value in this Area
Purchase History
We collect this data history from publicly available records. To have your information removed, we recommend requesting removal directly through your county’s website.
| Date | Buyer | Sale Price | Title Company |
|---|---|---|---|
| Mendez Luis M | $65,500 | First American Title Company | |
| Best Real Estate Investment Inc | $35,000 | Placer Title Company | |
| Oconnell William Frank | $22,000 | Fidelity National Title Co | |
| Morcap Real Estate Opportunity Fund I Ll | $3,000 | Chicago Title Servicelink Di | |
| Real Holdings Llc | $3,000 | Chicago Title Servicelink Di | |
| Blue Spruce Entities Llc | -- | None Available | |
| Wells Fargo Bank Na | $148,229 | Accommodation | |
| Toki Fukaeiki Tom | -- | Alliance Title Co | |
| Toki Fukaeiki Tom | -- | Alliance Title Co | |
| Toki Fukaeiki Tom | $85,000 | Alliance Title Co | |
| Toki Fukaeiki Tom | $78,000 | Central Valley Title Co | |
| Bresock Hal N | -- | -- | |
| Bresock Leland | -- | -- |
Source: Public Records
Mortgage History
We collect this data history from publicly available records. To have your information removed, we recommend requesting removal directly through your county’s website.
| Date | Status | Borrower | Loan Amount |
|---|---|---|---|
| Open | Mendez Luis M | $58,950 | |
| Previous Owner | Best Real Estate Investment Inc | $17,500 | |
| Previous Owner | Toki Fukaeiki Tom | $148,000 | |
| Previous Owner | Toki Fukaeiki Tom | $103,000 | |
| Previous Owner | Toki Fukaeiki Tom | $127,500 | |
| Previous Owner | Toki Fukaeiki Tom | $82,500 |
Source: Public Records
Tax History
| Year | Tax Paid | Tax Assessment Tax Assessment Total Assessment is a certain percentage of the fair market value that is determined by local assessors to be the total taxable value of land and additions on the property. | Land | Improvement |
|---|---|---|---|---|
| 2025 | $1,058 | $82,263 | $20,094 | $62,169 |
| 2024 | $1,040 | $80,650 | $19,700 | $60,950 |
| 2023 | $1,017 | $79,069 | $19,314 | $59,755 |
| 2022 | $986 | $77,520 | $18,936 | $58,584 |
| 2021 | $948 | $76,001 | $18,565 | $57,436 |
| 2020 | $966 | $75,223 | $18,375 | $56,848 |
| 2019 | $962 | $73,749 | $18,015 | $55,734 |
| 2018 | $944 | $72,304 | $17,662 | $54,642 |
| 2017 | $895 | $70,887 | $17,316 | $53,571 |
| 2016 | $911 | $69,497 | $16,976 | $52,521 |
| 2014 | $868 | $67,113 | $16,394 | $50,719 |
Source: Public Records
Map
Nearby Homes
- 2117 E Washington St
- 2030 E Lafayette St
- 2040 E Main St
- 2335 E Washington St
- 2006 E Lafayette St
- 2018 E Myrtle St
- 2487 E Sonora St
- 2497 E Marsh St
- 2544 E Marsh St
- 2338 E Miner Ave
- 425 Burkett Ave
- 0 Park Unit SR25247647
- 524 Burkett Ave
- 2136 E Market St
- 447 S Shasta Ave
- 2239 Finland Ave
- 2126 E Fremont St
- 1640 E Hazelton Ave
- 1640 E Scotts Ave
- 941 Burkett Ave
- 2243 E Marsh St
- 2223 E Marsh St
- 2250 E Main St
- 2238 E Main St
- 2217 E Marsh St
- 2242 E Main St
- 2254 E Main St
- 2230 E Main St
- 2211 E Marsh St
- 2232 E Marsh St
- 2242 E Marsh St
- 2222 E Marsh St
- 2205 E Marsh St
- 2208 E Main St
- 2252 E Marsh St
- 406 Court St
- 2260 E Marsh St
- 412 Court St
- 2268 E Marsh St
- 2235 Alma St
Your Personal Tour Guide
Ask me questions while you tour the home.