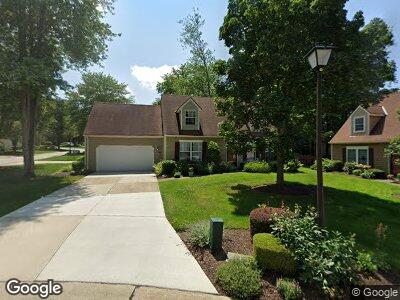
2235 Pine Tree Ln Unit 4 Twinsburg, OH 44087
Estimated Value: $221,103 - $263,000
4
Beds
2
Baths
1,836
Sq Ft
$133/Sq Ft
Est. Value
About This Home
This home is located at 2235 Pine Tree Ln Unit 4, Twinsburg, OH 44087 and is currently estimated at $244,276, approximately $133 per square foot. 2235 Pine Tree Ln Unit 4 is a home located in Summit County with nearby schools including Wilcox Primary School, Dodge Intermediate School, and Samuel Bissell Elementary School.
Ownership History
Date
Name
Owned For
Owner Type
Purchase Details
Closed on
Jul 10, 2014
Sold by
Burke Michael J
Bought by
Burke Stacey M
Current Estimated Value
Purchase Details
Closed on
Aug 27, 1997
Sold by
Keough Kevin E
Bought by
Burke Michael J and Burke Stacey M
Home Financials for this Owner
Home Financials are based on the most recent Mortgage that was taken out on this home.
Original Mortgage
$123,050
Interest Rate
7.57%
Mortgage Type
New Conventional
Purchase Details
Closed on
Feb 22, 1995
Sold by
Jones Gerran L
Bought by
Keough Kevin E
Home Financials for this Owner
Home Financials are based on the most recent Mortgage that was taken out on this home.
Original Mortgage
$102,000
Interest Rate
7.38%
Mortgage Type
New Conventional
Create a Home Valuation Report for This Property
The Home Valuation Report is an in-depth analysis detailing your home's value as well as a comparison with similar homes in the area
Home Values in the Area
Average Home Value in this Area
Purchase History
| Date | Buyer | Sale Price | Title Company |
|---|---|---|---|
| Burke Stacey M | -- | None Available | |
| Burke Michael J | $132,550 | -- | |
| Keough Kevin E | $114,000 | -- |
Source: Public Records
Mortgage History
| Date | Status | Borrower | Loan Amount |
|---|---|---|---|
| Open | Burke Stacey M | $65,000 | |
| Closed | Burke Michael J | $73,500 | |
| Closed | Burke Michael J | $96,000 | |
| Closed | Burke Michael J | $19,000 | |
| Closed | Burke Michael J | $115,400 | |
| Closed | Burke Michael J | $123,050 | |
| Previous Owner | Keough Kevin E | $102,000 |
Source: Public Records
Tax History Compared to Growth
Tax History
| Year | Tax Paid | Tax Assessment Tax Assessment Total Assessment is a certain percentage of the fair market value that is determined by local assessors to be the total taxable value of land and additions on the property. | Land | Improvement |
|---|---|---|---|---|
| 2025 | $4,699 | $61,264 | $6,769 | $54,495 |
| 2024 | $3,225 | $61,264 | $6,769 | $54,495 |
| 2023 | $4,699 | $61,264 | $6,769 | $54,495 |
| 2022 | $2,948 | $48,241 | $5,331 | $42,910 |
| 2021 | $2,960 | $48,241 | $5,331 | $42,910 |
| 2020 | $2,884 | $48,240 | $5,330 | $42,910 |
| 2019 | $2,748 | $43,410 | $5,850 | $37,560 |
| 2018 | $2,712 | $43,410 | $5,850 | $37,560 |
| 2017 | $2,322 | $43,410 | $5,850 | $37,560 |
| 2016 | $2,308 | $43,410 | $5,850 | $37,560 |
| 2015 | $2,322 | $43,410 | $5,850 | $37,560 |
| 2014 | $2,253 | $43,410 | $5,850 | $37,560 |
| 2013 | $2,583 | $49,820 | $5,850 | $43,970 |
Source: Public Records
Map
Nearby Homes
- 9549 Ridge Ct
- 1946 Ridge Meadow Ct
- 9650 E Idlewood Dr
- 1961 Ridge Meadow Ct
- 9451 Fairfield Dr
- 10413 Fox Hollow Cir
- 10359 Fox Hollow Cir
- 1723 Laurel Dr
- 1926 Glenwood Dr
- 1553 Iris Glen Dr
- 9878 Ridgewood Dr
- 2191 Sherwin Dr
- 0 Chamberlin Rd Unit 5110799
- 1515 Iris Glen Dr Unit 1515
- 2380 Croydon Rd
- 9666 Darrow Rd
- 9101 Chamberlin Rd
- 9116 Chamberlin Rd
- SL 2 Chamberlin Rd
- SL3 Chamberlin Rd
- 2235 Pine Tree Ln
- 2235 Pine Tree Ln Unit 4
- 2231 Pine Tree Ln Unit 3
- 2231 Pine Tree Ln
- 2239 Pine Tree Ln
- 2239 Pine Tree Ln Unit 5
- 2227 Pine Tree Ln
- 2243 Pine Tree Ln
- 9556 Olde Pond Ln
- 9556 Olde Pond Ln Unit 40
- 9552 Olde Pond Ln Unit 1
- 2223 Pine Tree Ln
- 2223 Pine Tree Ln Unit 1
- 2238 Pine Tree Ln
- 2247 Pine Tree Ln
- 2234 Pine Tree Ln
- 2234 Pine Tree Ln Unit 17
- 2226 Pine Tree Ln Unit 19
- 2242 Pine Tree Ln
- 9548 Olde Pond Ln