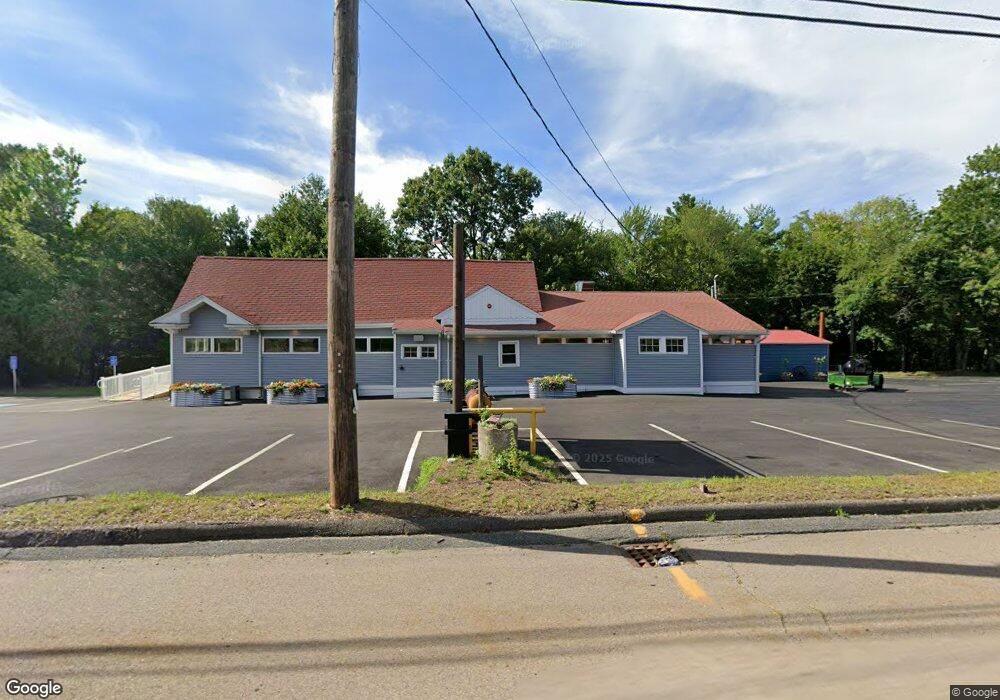
2235 Providence Hwy Walpole, MA 02081
Estimated Value: $1,276,449
--
Bed
--
Bath
2,727
Sq Ft
$468/Sq Ft
Est. Value
About This Home
This home is located at 2235 Providence Hwy, Walpole, MA 02081 and is currently estimated at $1,276,449, approximately $468 per square foot. 2235 Providence Hwy is a home located in Norfolk County with nearby schools including Boyden School, Eleanor N. Johnson Middle School, and Walpole High School.
Ownership History
Date
Name
Owned For
Owner Type
Purchase Details
Closed on
Jan 29, 2009
Sold by
Campanario George A and Campanario Joseph A
Bought by
Ssr Rt and Murphy
Current Estimated Value
Home Financials for this Owner
Home Financials are based on the most recent Mortgage that was taken out on this home.
Original Mortgage
$20,000
Interest Rate
5.28%
Mortgage Type
Commercial
Create a Home Valuation Report for This Property
The Home Valuation Report is an in-depth analysis detailing your home's value as well as a comparison with similar homes in the area
Home Values in the Area
Average Home Value in this Area
Purchase History
| Date | Buyer | Sale Price | Title Company |
|---|---|---|---|
| Ssr Rt | $583,000 | -- | |
| Ssr Rt | $583,000 | -- |
Source: Public Records
Mortgage History
| Date | Status | Borrower | Loan Amount |
|---|---|---|---|
| Open | Ssr Rt | $284,000 | |
| Closed | Ssr Rt | $52,800 | |
| Closed | Ssr Rt | $20,000 |
Source: Public Records
Tax History Compared to Growth
Tax History
| Year | Tax Paid | Tax Assessment Tax Assessment Total Assessment is a certain percentage of the fair market value that is determined by local assessors to be the total taxable value of land and additions on the property. | Land | Improvement |
|---|---|---|---|---|
| 2025 | $13,699 | $790,000 | $749,300 | $40,700 |
| 2024 | $13,774 | $769,500 | $729,600 | $39,900 |
| 2023 | $13,292 | $721,600 | $681,700 | $39,900 |
| 2022 | $12,895 | $670,900 | $631,000 | $39,900 |
| 2021 | $12,426 | $630,100 | $590,200 | $39,900 |
| 2020 | $12,544 | $629,100 | $590,200 | $38,900 |
| 2019 | $12,265 | $610,800 | $572,700 | $38,100 |
| 2018 | $12,035 | $592,000 | $555,000 | $37,000 |
| 2017 | $11,858 | $581,000 | $544,600 | $36,400 |
| 2016 | $11,516 | $555,500 | $519,600 | $35,900 |
| 2015 | $11,091 | $529,900 | $495,100 | $34,800 |
| 2014 | $10,831 | $514,800 | $480,500 | $34,300 |
Source: Public Records
Map
Nearby Homes
- 1549 Washington St Unit A
- 137 Beach St
- 2 Thompson Rd
- 16R Eldor Dr
- 35 Shoreline Dr
- 69 Morningside Dr
- 180 Old Post Rd Unit 202
- 180 Old Post Rd Unit 206
- 180 Old Post Rd Unit 201
- 180 Old Post Rd Unit 207
- 0 U S Route 1
- 587 Common St
- 1 Roseland St Unit A-1
- 1648 Main St
- 97 Old Post Rd
- 91 Old Post Rd
- 73 Ridge Rd
- 375 Winter St
- 635 Old Post Rd Unit 303
- 635 Old Post Rd Unit 302
- 2222 Boston Providence Hwy
- 2222 Boston Providence Turnpike
- 2222 Providence Hwy
- 0 US Route 1
- 8 Deepwater Ln
- 7 Deepwater Ln
- 1 Foxhill Dr
- 3 Deepwater Ln
- 1234 Hilltop Dr
- 12 Treeland Dr
- 2250 Providence Hwy
- 4 Deepwater Ln
- 8 Treeland Dr
- 19 Treeland Dr
- 11 Whiting Ave
- 13 Whiting Ave
- 15 Whiting Ave
- 9 Whiting Ave
- 11 Treeland Dr
- 15 Treeland Dr