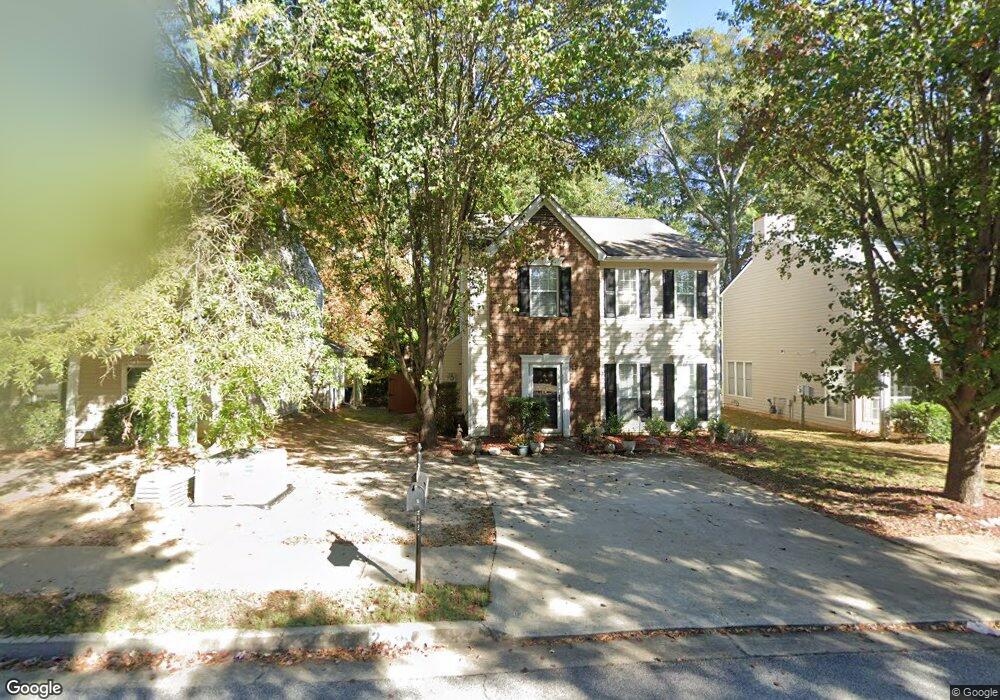
2236 Asquith Ave SW Unit 1 Marietta, GA 30008
Estimated Value: $291,000 - $324,000
3
Beds
3
Baths
1,680
Sq Ft
$181/Sq Ft
Est. Value
About This Home
This home is located at 2236 Asquith Ave SW Unit 1, Marietta, GA 30008 and is currently estimated at $303,398, approximately $180 per square foot. 2236 Asquith Ave SW Unit 1 is a home located in Cobb County with nearby schools including Clarkdale Elementary School, Cooper Middle School, and Jubilee Christian Prep Academy.
Ownership History
Date
Name
Owned For
Owner Type
Purchase Details
Closed on
May 23, 2006
Sold by
My House In Llc
Bought by
Dulaney Bonnett
Current Estimated Value
Home Financials for this Owner
Home Financials are based on the most recent Mortgage that was taken out on this home.
Original Mortgage
$27,980
Outstanding Balance
$16,297
Interest Rate
6.5%
Mortgage Type
New Conventional
Estimated Equity
$287,101
Purchase Details
Closed on
Jan 3, 2006
Sold by
Jones Kevin
Bought by
My House In Llc
Purchase Details
Closed on
Apr 15, 1998
Sold by
R Horton Inc-Torrey D
Bought by
Wright Bruce E
Home Financials for this Owner
Home Financials are based on the most recent Mortgage that was taken out on this home.
Original Mortgage
$98,415
Interest Rate
7.09%
Mortgage Type
FHA
Create a Home Valuation Report for This Property
The Home Valuation Report is an in-depth analysis detailing your home's value as well as a comparison with similar homes in the area
Home Values in the Area
Average Home Value in this Area
Purchase History
| Date | Buyer | Sale Price | Title Company |
|---|---|---|---|
| Dulaney Bonnett | $139,900 | -- | |
| My House In Llc | $101,500 | -- | |
| Wright Bruce E | $100,900 | -- |
Source: Public Records
Mortgage History
| Date | Status | Borrower | Loan Amount |
|---|---|---|---|
| Open | Dulaney Bonnett | $27,980 | |
| Previous Owner | Wright Bruce E | $98,415 |
Source: Public Records
Tax History Compared to Growth
Tax History
| Year | Tax Paid | Tax Assessment Tax Assessment Total Assessment is a certain percentage of the fair market value that is determined by local assessors to be the total taxable value of land and additions on the property. | Land | Improvement |
|---|---|---|---|---|
| 2025 | $716 | $129,136 | $28,000 | $101,136 |
| 2024 | $2,946 | $129,136 | $28,000 | $101,136 |
| 2023 | $1,712 | $97,264 | $16,000 | $81,264 |
| 2022 | $1,950 | $82,564 | $12,000 | $70,564 |
| 2021 | $1,639 | $68,356 | $12,000 | $56,356 |
| 2020 | $1,524 | $63,080 | $12,000 | $51,080 |
| 2019 | $1,511 | $62,472 | $12,000 | $50,472 |
| 2018 | $1,289 | $52,356 | $7,200 | $45,156 |
| 2017 | $1,228 | $52,356 | $7,200 | $45,156 |
| 2016 | $1,009 | $44,000 | $7,200 | $36,800 |
| 2015 | $856 | $37,880 | $7,200 | $30,680 |
| 2014 | $505 | $25,828 | $0 | $0 |
Source: Public Records
Map
Nearby Homes
- 2289 Clare Cottage Cove SW
- 2058 Mulkey Rd SW
- 3530 Argent Way
- 2517 Kolb Manor Cir SW
- 2613 Kolb Manor Cir SW
- 3310 Bryan Way SW
- 3782 Mulkey Cir SW Unit 18
- 3782 Mulkey Cir SW
- 3269 Perch Dr SW
- 3755 Mulkey Cir SW
- 1905 Azure Grove Ct
- 3253 Shadowridge Dr SW
- 3564 Ashley Station Dr SW
- 3559 Ashley Station Dr SW
- 1803 Silver Leaf Dr SW
- 1763 Merry Oak Rd SW
- 2622 Sheffield Ct SW
- 1702 Merry Oak Rd SW
- 2240 Asquith Ave SW
- 2232 Asquith Ave SW Unit 1
- 2244 Asquith Ave SW Unit 1
- 2228 Asquith Ave SW
- 2241 Asquith Avenue Sw 0
- 2224 Asquith Ave SW
- 3517 Clare Cottage Trace SW
- 3515 Clare Cottage Trace SW
- 2252 Asquith Ave SW
- 2252 Asquith Ave SW Unit 1
- 3519 Clare Cottage Trace SW
- 0 Asquith Ave SW Unit 7420890
- 0 Asquith Ave SW Unit 7214434
- 0 Asquith Ave SW Unit 3166775
- 0 Asquith Ave SW Unit 8879474
- 0 Asquith Ave SW Unit 8824889
- 0 Asquith Ave SW Unit 8401065
- 0 Asquith Ave SW Unit 8289473
- 0 Asquith Ave SW Unit 8272204
- 0 Asquith Ave SW Unit 8231940